 Data Structure
 Networking
 RDBMS
RDBMS Operating System
 Java
Java MS Excel
 iOS
iOS HTML
HTML CSS
CSS Android
 Python
 C Programming
 C++
C++ C#
C# MongoDB
 MySQL
MySQL Javascript
 PHP
PHP
- Selected Reading
- UPSC IAS Exams Notes
- Developer's Best Practices
- Questions and Answers
- Effective Resume Writing
- HR Interview Questions
- Computer Glossary
- Who is Who
How to plot a graph in Python?
Graphs in Python can be plotted by using the Matplotlib library. Matplotlib library is mainly used for graph plotting.
You need to install matplotlib before using it to plot graphs. Matplotlib is used to draw a simple line, bargraphs, histograms and piecharts. Inbuilt functions are available to draw all types of graphs in the matplotlib library.
Plot a line in a graph
We will plot a simple line in a graph using matplotlib. The following steps are involved in plotting a line.
Import matplotlib
Specify the x-coordinates and y-coordinates of the line
Plot the specified points using specific function using .plot() function
Name the x-axis and y-axis using .xlabel() and .ylabel() functions
Give a title to the graph(optional) using .title() function
Show the graph using .show() function
These are the simple steps involved in plotting a line using matplotlib.
Example
import matplotlib.pyplot as plt

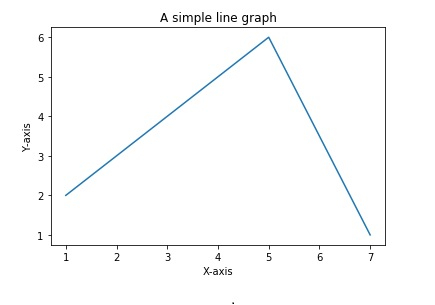
x=[1,3,5,7]
y=[2,4,6,1]
plt.plot(x,y)
plt.xlabel('X-axis')
plt.ylabel('Y-axis')
plt.title("A simple line graph")
plt.show()
The above code plots the points (1,2),(3,4),(5,6),(7,1) and joins these points with a line which is shown as the graph.
Output

Plot a bar graph
A bar graph is the way of representing data by rectangles of different heights at specific positions on the x-axis.
The following steps are involved in drawing a bar graph ?
Import matplotlib
Specify the x-coordinates where the left bottom corner of the rectangle lies.
Specify the heights of the bars or rectangles.
Specify the labels for the bars
Plot the bar graph using .bar() function
Give labels to the x-axis and y-axis
Give a title to the graph
Show the graph using .show() function.
Example
import matplotlib.pyplot as plt

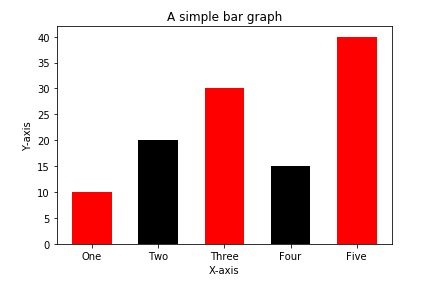
left_coordinates=[1,2,3,4,5]
heights=[10,20,30,15,40]
bar_labels=['One','Two','Three','Four','Five']
plt.bar(left_coordinates,heights,tick_label=bar_labels,width=0.6,color=['re
d','black'])
plt.xlabel('X-axis')
plt.ylabel('Y-axis')
plt.title("A simple bar graph")
plt.show()
The width parameter in the plt.bar() specifies the width of each bar. The color lists specify the colors of the bars.
Output


