 Data Structure
 Networking
 RDBMS
RDBMS Operating System
 Java
Java MS Excel
 iOS
iOS HTML
HTML CSS
CSS Android
 Python
 C Programming
 C++
C++ C#
C# MongoDB
 MySQL
MySQL Javascript
 PHP
PHP
- Selected Reading
- UPSC IAS Exams Notes
- Developer's Best Practices
- Questions and Answers
- Effective Resume Writing
- HR Interview Questions
- Computer Glossary
- Who is Who
How to Add Markers to a Graph Plot in Matplotlib with Python?
While creating plots using Matplotlib which is a library of Python one common task is to add markers to indicate data points. Matplotlib provides a variety of marker styles which includes circles, triangles, squares, dots, and diamonds. These markers can be customized further with different sizes, colors, and edge sizes. In this article, we will discuss how to add markers to a graph plot and customize them in Matplotlib with Python.
Matplotlib
Matplotlib is a library that is mainly used for plotting graphs and plots for the Python programming language and NumPy, its extension for numerical mathematics. Tkinter, wxPython, Qt, and GTK GUI toolkits may include diagrams utilizing its object-oriented API.
The matplotlib.pyplot is a collection of command-style methods that allow matplotlib to function similarly to MATLAB. Each pyplot function alters a figure in some manner, whether it is by adding a plotting area, plotting lines, adding labels, etc.
Pyplot is a submodule of the Python matplotlib utility. It is a Python library containing a collection of functions and methods for plotting 2D graphs.
Matplotlib.markers
The marker parameter of the matplotlib is used to add markers to the graph plots. It has some functions to handle the markers. It is used by both plot and scatter for marker functionality.
Syntax
plt.plot(values, marker= ?value')
How to add markers to the graph plot in Matplotlib?
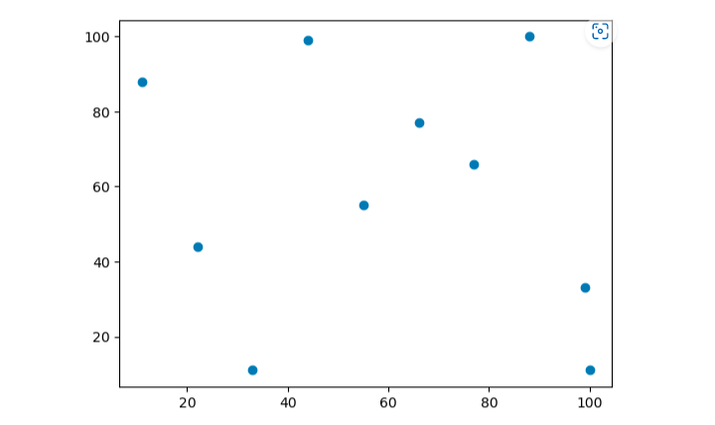
We will use the marker parameter of Matplotlib to add markers to the graph plots.
Let us look at one example ?
Example
import matplotlib.pyplot as p

# Create some sample data
x = [11, 22, 33, 44, 55,66,77,88,99,100]
y = [88, 44, 11, 99, 55,77,66,100,33,11]

# Create a scatter plot with circles as markers
p.scatter(x, y, marker='o')

# Show the plot
p.show()
Output

Customizing marker size and color
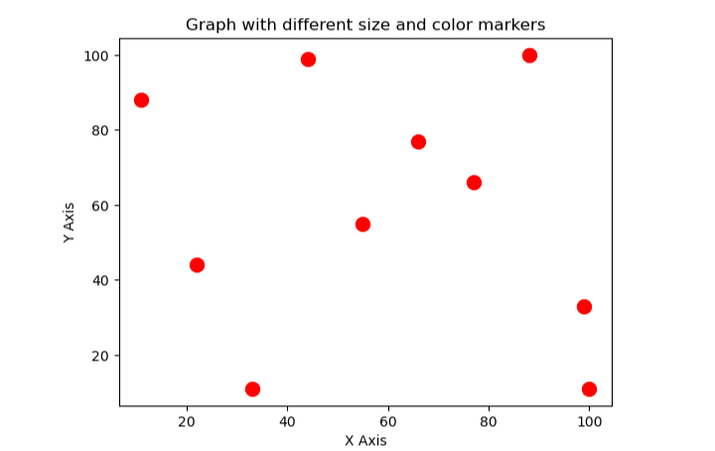
We can customize the size and the color of the makers using the s and c parameters of the scatter() function. The s parameter specifies the size of the markers, and the c parameter specifies the color of the markers. Let us look at one example.
Example
import matplotlib.pyplot as p

# Create some sample data
x = [11, 22, 33, 44, 55, 66, 77, 88, 99, 100]
y = [88, 44, 11, 99, 55, 77, 66, 100, 33, 11]

# Create a scatter plot with customized markers
p.scatter(x, y, marker='o', s=100, c='red')

# Add labels and title
p.xlabel('X Axis')
p.ylabel('Y Axis')
p.title('Graph with different size and color markers')

# Show the plot
p.show()
Output

In the above example, we have set the size of marker 100 and the color red.
Customizing marker edge style
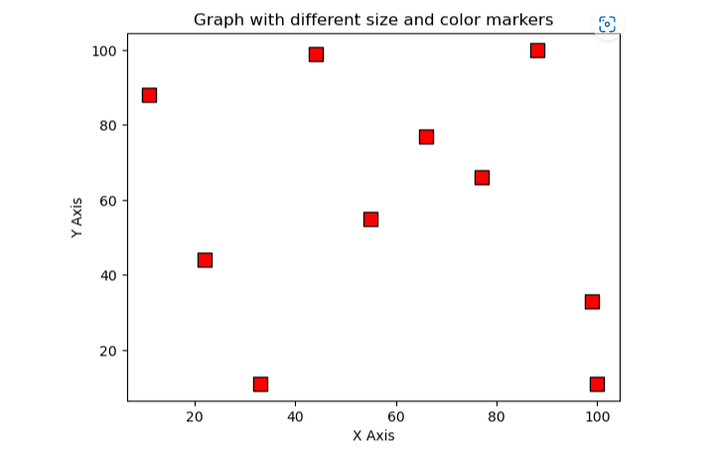
We can also customize the edge style of the markers by using the edgecolors parameter of the function scatter(). The edgecolors parameter specifies the color of the edges of the markers.
Example
import matplotlib.pyplot as p

# Create some sample data
x = [11, 22, 33, 44, 55, 66, 77, 88, 99, 100]
y = [88, 44, 11, 99, 55, 77, 66, 100, 33, 11]

# Create a scatter plot with customized markers
p.scatter(x, y, marker='s', s=100, c='red', edgecolors='black')

# Add labels and title
p.xlabel('X Axis')
p.ylabel('Y Axis')
p.title('Graph with different size and color markers')

# Show the plot
p.show()
Output

Using different Marker Styles
Matplotlib provides a variety of marker styles that can be used to indicate data points on a graph plot. Below is the table that lists some commonly used marker styles.
S.No |
Marker style |
Description |
|---|---|---|
1. |
?o' |
Circle-shaped marker |
2. |
?s' |
Square-shaped marker |
3. |
?^' |
Triangle-shaped marker |
4. |
?d' |
Diamond-shaped marker |
5. |
?.' |
Dot-shaped marker |
To use a different marker style, simply set the marker parameter of the scatter() function to the desired marker style that you want.
Program for adding diamond markers
import matplotlib.pyplot as plt

# Create some sample data
x = [11, 22, 33, 44, 55, 66, 77, 88, 99, 100]
y = [88, 44, 11, 99, 55, 77, 66, 100, 33, 11]

# Create a scatter plot with triangles as markers
plt.scatter(x, y, marker='d', s=100, c='blue', edgecolors='black')

# Add labels and title
plt.xlabel('X Axis')
plt.ylabel('Y Axis')
plt.title('Graph with diamond-shaped markers')

# Show the plot
plt.show()
Output

Program for adding triangle markers
import matplotlib.pyplot as p

# Create some sample data
x = [11, 22, 33, 44, 55,66,77,88,99,100]
y = [88, 44, 11, 99, 55,77,66,100,33,11]


# Create a scatter plot with triangles as markers
p.scatter(x, y, marker='^')

# Add labels and title
p.xlabel('X Axis')
p.ylabel('Y Axis')
p.title('Graph with Triangle Markers')

# Show the plot
p.show()
Output

Conclusion
In conclusion, we can add markers to a graph plot in Matplotlib with Python which we can customize according to our needs. Matpoltlib provides a variety of marker styles which includes circles, diamonds, dots, triangles, and squares that can be used to indicate data points on the plot. The size, color, and edge style of the marker can also be customized using various different parameters of the scatter() function. We can create a visually appealing and informative plot with the help of markers using Matplotlib in Python.

