
Article Categories
- All Categories
-
 Data Structure
-
 Networking
-
 RDBMS
RDBMS
-
 Operating System
-
 Java
Java
-
 MS Excel
-
 iOS
iOS
-
 HTML
HTML
-
 CSS
CSS
-
 Android
-
 Python
-
 C Programming
-
 C++
C++
-
 C#
C#
-
 MongoDB
-
 MySQL
MySQL
-
 Javascript
-
 PHP
PHP
-
 Economics & Finance
Selected Reading
How to get a matplotlib Axes instance to plot to?
To get the axes instance, we will use the subplots() method.
Steps
Make a list of years.
Make a list of populations in that year.
Get the number of labels using np.arrange(len(years)) method.
Set the width of the bars.
Create fig and ax variables using subplots() method, where default nrows and ncols are 1.
Set the Y-axis label of the figure using set_ylabel().
Set the title of the figure, using set_title() method.
Set the x-ticks with x that is created in step 3, using set_xticks method.
Set the xtick_labels with years data, using set_xticklabels method.
Use plt.show() method to show the figure.
Example
from matplotlib import pyplot as plt
import numpy as np
years = [1901, 1911, 1921, 1931, 1941, 1951, 1961, 1971, 1981, 1991, 2001, 2011]
population = [237.4, 238.4, 252.09, 251.31, 278.98, 318.66, 361.09, 439.23, 548.16, 683.33, 846.42, 1028.74]
x = np.arange(len(years)) # the label locations
width = 0.35 # the width of the bars
fig, ax = plt.subplots() # axes instance
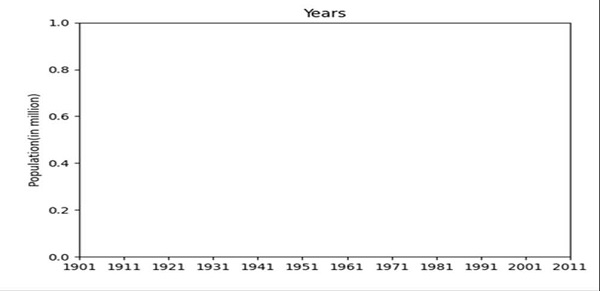
ax.set_ylabel('Population(in million)')
ax.set_title('Years')
ax.set_xticks(x)
ax.set_xticklabels(years)
plt.show()
Output

Updated on: 2021-03-16T10:41:32+05:30
590 Views

Advertisements