 Data Structure
 Networking
 RDBMS
RDBMS Operating System
 Java
Java MS Excel
 iOS
iOS HTML
HTML CSS
CSS Android
 Python
 C Programming
 C++
C++ C#
C# MongoDB
 MySQL
MySQL Javascript
 PHP
PHP
- Selected Reading
- UPSC IAS Exams Notes
- Developer's Best Practices
- Questions and Answers
- Effective Resume Writing
- HR Interview Questions
- Computer Glossary
- Who is Who
Centering x-tick labels between tick marks in Matplotlib
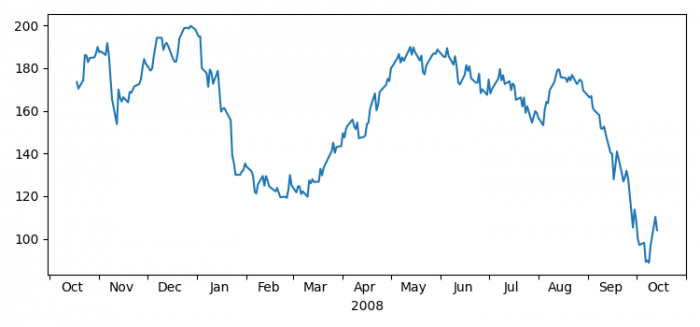
To place labels between two ticks, we can take the following steps−
- Load some sample data, r.
- Create a copy of the array, cast to a specified type.
- Create a figure and a set of subplots using subplots() method.
- Plot date and r sample data.
- Set the locator of the major/minor ticker using set_major_locator() and set_minor_locator() methods.
- Set the locator of the major/minor formatter using set_major_locator() and set_minor_formatter() methods.
- Now, place the ticklabel at the center.
- To display the figure, use show() method.
Example
import numpy as np
import matplotlib.cbook as cbook
import matplotlib.dates as dates
import matplotlib.ticker as ticker
import matplotlib.pyplot as plt
plt.rcParams["figure.figsize"] = [7.00, 3.50]
plt.rcParams["figure.autolayout"] = True
with cbook.get_sample_data('aapl.npz') as fh:
   r = np.load(fh)['price_data'].view(np.recarray)
r = r[-250:]
date = r.date.astype('O')
fig, ax = plt.subplots()
ax.plot(date, r.adj_close)
ax.xaxis.set_major_locator(dates.MonthLocator())
ax.xaxis.set_minor_locator(dates.MonthLocator(bymonthday=15))
ax.xaxis.set_major_formatter(ticker.NullFormatter())
ax.xaxis.set_minor_formatter(dates.DateFormatter('%b'))
for tick in ax.xaxis.get_minor_ticks():
   tick.tick1line.set_markersize(0)
   tick.tick2line.set_markersize(0)
   tick.label1.set_horizontalalignment('center')
imid = len(r) // 2
ax.set_xlabel(str(date[imid].year))
plt.show()
Output


Advertisements
