
Article Categories
- All Categories
-
 Data Structure
-
 Networking
-
 RDBMS
RDBMS
-
 Operating System
-
 Java
Java
-
 MS Excel
-
 iOS
iOS
-
 HTML
HTML
-
 CSS
CSS
-
 Android
-
 Python
-
 C Programming
-
 C++
C++
-
 C#
C#
-
 MongoDB
-
 MySQL
MySQL
-
 Javascript
-
 PHP
PHP
-
 Economics & Finance
Selected Reading
How to find the size of the plotting window in R?
The plotting window size can be found by using dev.size function and we can pass in for inches and cm for centimeters. For example, if we create a plot then we can use dev.size("in") to find the plot size in inches and dev.size("cm") to find the size in centimeters.
Example
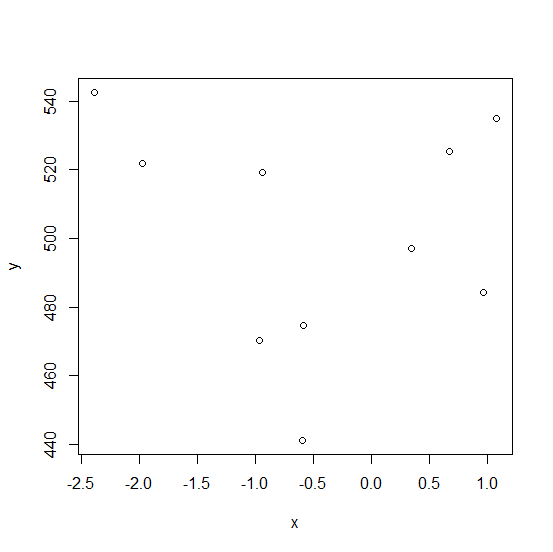
Consider the below vectors and create a point chart between those vectors −
x<-rnorm(10)
y<-rnorm(10,500,35)
plot(x,y)
Output
Now finding the plotting window size −
Example
dev.size("in") # in inches
Output
[1] 5.760417 5.750000
Example
dev.size("cm") # in centimeters
Output
[1] 14.63146 14.60500
This will change if we drag the plotting window to right, left, upper or down side as shown below (dragging the plotting window to left) −
Now again finding the size −
Example
dev.size("in")
Output
[1] 6.614583 5.750000
Example
dev.size("cm")
Output
[1] 16.80104 14.60500
This will not change until and unless we do not increase the plotting window manually.

Updated on: 2026-03-11T22:50:52+05:30
2K+ Views

Advertisements