
Article Categories
- All Categories
-
 Data Structure
-
 Networking
-
 RDBMS
RDBMS
-
 Operating System
-
 Java
Java
-
 MS Excel
-
 iOS
iOS
-
 HTML
HTML
-
 CSS
CSS
-
 Android
-
 Python
-
 C Programming
-
 C++
C++
-
 C#
C#
-
 MongoDB
-
 MySQL
MySQL
-
 Javascript
-
 PHP
PHP
-
 Economics & Finance
Selected Reading
How to rotate text in base R plot?
To write the text in a base R plot, firstly we should create a blank chart by using type="n" if we want to plot only text then the text should be introduced with the help of text function. Now, if we want to rotate the text value then srt argument can be used. For example, if we want to rotate the text to 45 degree then srt = -45 can be used.
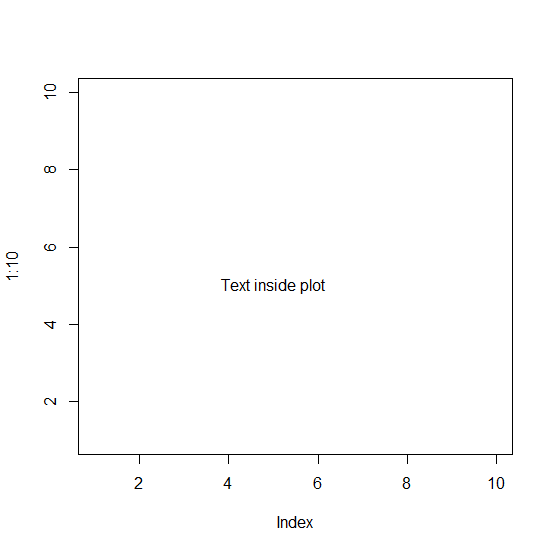
Example1
> plot(1:10,type="n")
> text(x=5,y=5,"Text inside plot")
Output
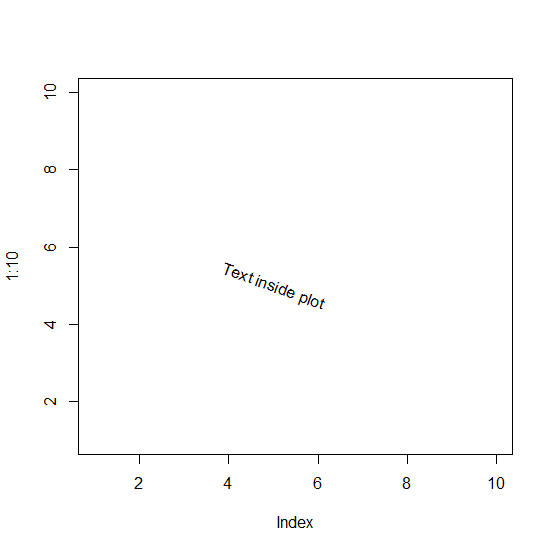
Example2
> plot(1:10,type="n")
> text(x=5,y=5,"Text inside plot",srt=-20)
Output
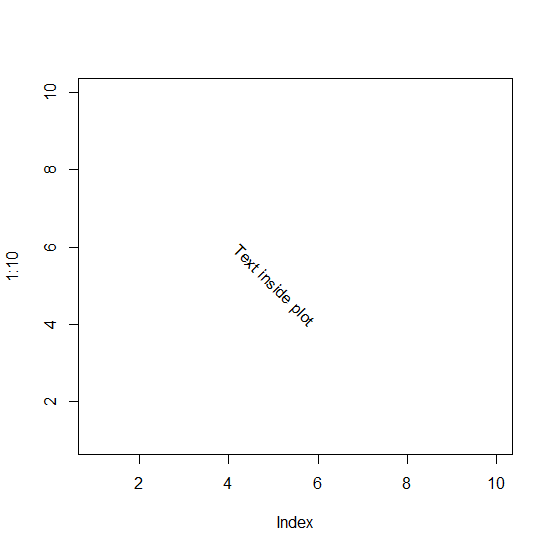
Example3
> plot(1:10,type="n")
> text(x=5,y=5,"Text inside plot",srt=-45)
Output

Updated on: 2026-03-11T22:50:53+05:30
9K+ Views

Advertisements