
Article Categories
- All Categories
-
 Data Structure
-
 Networking
-
 RDBMS
RDBMS
-
 Operating System
-
 Java
Java
-
 MS Excel
-
 iOS
iOS
-
 HTML
HTML
-
 CSS
CSS
-
 Android
-
 Python
-
 C Programming
-
 C++
C++
-
 C#
C#
-
 MongoDB
-
 MySQL
MySQL
-
 Javascript
-
 PHP
PHP
-
 Economics & Finance
Selected Reading
How to display square root sign in base R plot?
To display square root sign in base R plot, we can follow the below steps −
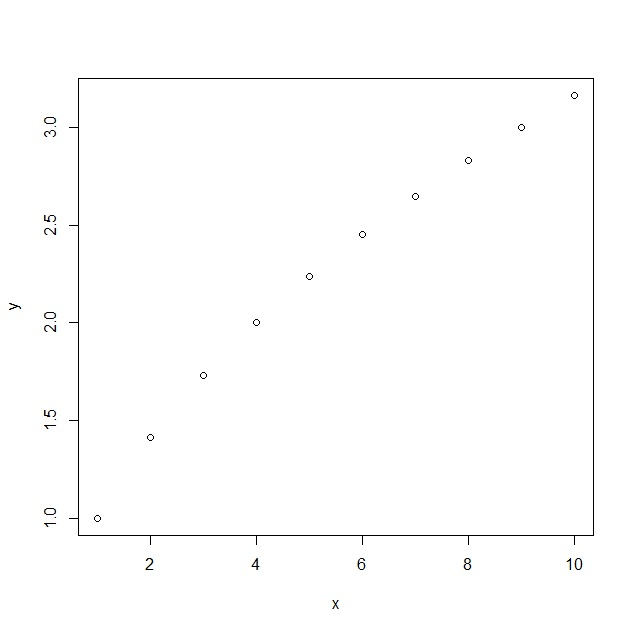
First of all, create a plot having square root values to display default visualisation.
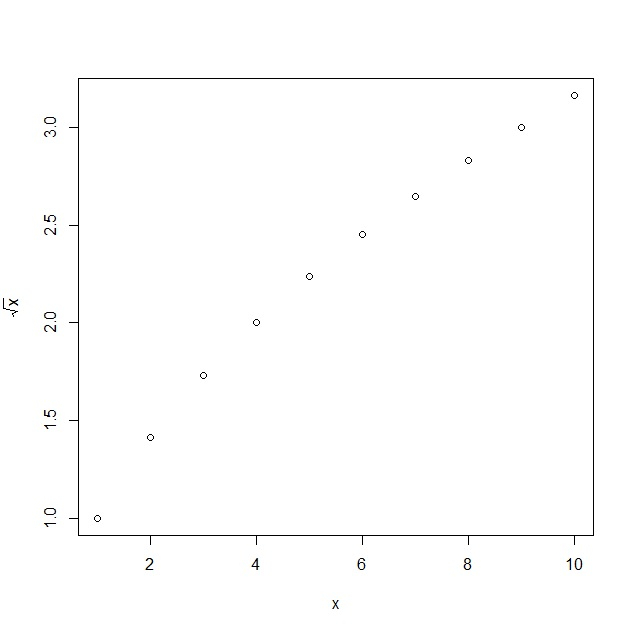
Then, create the plot with expression function to display square root sign in the plot.
Example
Create plot in base R
Using plot function to create a plot in base R with square root values as shown below −
xOutput
Display square root sign in the plot
Create the plot with plot and expression function to display square root sign in the plot as shown below −
xOutput

Updated on: 2021-11-15T10:41:29+05:30
668 Views

Advertisements