
Article Categories
- All Categories
-
 Data Structure
-
 Networking
-
 RDBMS
RDBMS
-
 Operating System
-
 Java
Java
-
 MS Excel
-
 iOS
iOS
-
 HTML
HTML
-
 CSS
CSS
-
 Android
-
 Python
-
 C Programming
-
 C++
C++
-
 C#
C#
-
 MongoDB
-
 MySQL
MySQL
-
 Javascript
-
 PHP
PHP
-
 Economics & Finance
Selected Reading
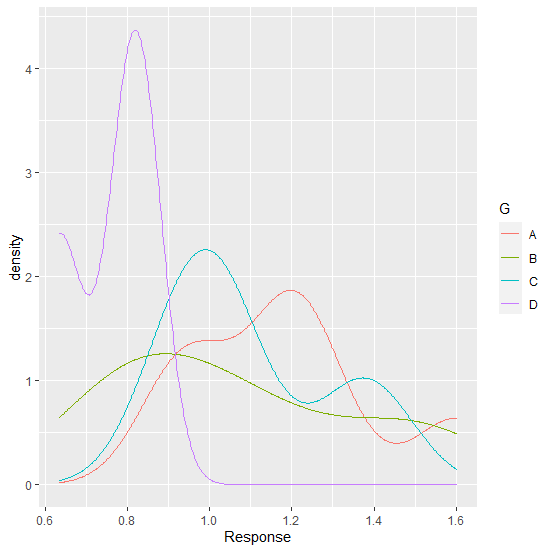
How to create smooth density curves without filling densities in R?
The density curves can be created by using stat_density function of ggplot2 package but it fills the curve with density hence it becomes difficult to recognize the curves. We can remove these densities by using geom="line" inside the stat_density function so that only the density curves will be plotted.
Example
Consider the below data frame:
> G<-sample(LETTERS[1:4],20,replace=TRUE)
> Response<-rnorm(20,1,0.34)
> df<-data.frame(G,Response)
> df
Output
G Response
1 C 1.0229016
2 C 1.0058160
3 B 0.8831558
4 B 0.7729167
5 C 0.9130468
6 D 0.8431893
7 B 1.5003581
8 A 0.9687335
9 B 1.1139661
10 A 0.9211660
11 A 1.1790619
12 D 0.6349671
13 A 1.2616918
14 A 1.6021078
15 C 0.9332981
16 C 1.0696149
17 D 0.7971567
18 C 1.4006042
19 C 1.3568032
20 A 1.1907336
Loading ggplot2 package and creating density curve without filling the densities:
Example
> library(ggplot2)
> ggplot(df,aes(Response))+stat_density(aes(group=G,color=G),position="identity",geom="line")
Output:

Updated on: 2026-03-11T22:50:53+05:30
644 Views

Advertisements