
Article Categories
- All Categories
-
 Data Structure
-
 Networking
-
 RDBMS
RDBMS
-
 Operating System
-
 Java
Java
-
 MS Excel
-
 iOS
iOS
-
 HTML
HTML
-
 CSS
CSS
-
 Android
-
 Python
-
 C Programming
-
 C++
C++
-
 C#
C#
-
 MongoDB
-
 MySQL
MySQL
-
 Javascript
-
 PHP
PHP
-
 Economics & Finance
How to Create Group BarChart in Android?
Information visualisation could be an imperative component of current versatile apps, permitting clients to quickly and instinctively decipher complicated data. Bar charts are a well-known information visualisation approach for comparing information across categories or groupings. In this article, we'll look at how to create a Gathered Bar Chart in Android using the well-known MPAndroidChart library. The MPAndroidChart library offers a comprehensive set of usefulness and customization alternatives for making intelligently and stylishly engaging charts in Android applications. You'll be able to essentially build Assembled Bar Charts by utilising this library, which shows information in discrete bunches for less demanding comparison and investigation.
Methods Used
-
MPAndroidChart library method
MPAndroidChart Library Method
Algorithm
Import the necessary classes and libraries ?
-
BarChart from the MPAndroidChart library
-
BarEntry, BarDataSet, and BarData for data representation
-
Colour to set colours for the bar groups
Set up the layout ?
-
Create a layout XML file that includes a BarChart view to display the chart.
Initialise the bar chart ?
-
In the activity's onCreate method, find the bar chart using its ID from the layout.
-
Configure any necessary properties of the bar chart, such as grid background, axis labels, or legends.
Prepare the data ?
-
Create BarEntry objects to represent the data for each group of bars.
-
Group the BarEntry objects into separate lists, each representing a distinct group.
Customise the appearance of each group ?
-
Create BarDataSet objects for each group of bars.
-
Set the desired colours for each bar data set using the setColor method.
Create the chart data ?
-
Create a list of IBarDataSet objects, adding the BarDataSet objects for each group.
-
Create a BarData object with the list of IBarDataSet objects.
Set the chart data as follows ?
-
Set the BarData object to the BarChart using the setData method.
Refresh the chart ?
-
Call the invalidate method on the bar chart to refresh its appearance and display the chart.
Xml Program
<?xml version="1.0" encoding="utf-8"?>
<RelativeLayout
	xmlns:android="http://schemas.android.com/apk/res/android"
	xmlns:tools="http://schemas.android.com/tools"
	android:layout_width="match_parent"
	android:layout_height="match_parent"
	tools:context=".MainActivity">

	<!--Ui component for our bar chart-->
	<com.github.mikephil.charting.charts.BarChart
		android:id="@+id/idBarChart"
		android:layout_width="match_parent"
		android:layout_height="match_parent" />

</RelativeLayout>
Java Program
import android.graphics.Color;
import android.os.Bundle;

import androidx.appcompat.app.AppCompatActivity;

import com.github.mikephil.charting.charts.BarChart;
import com.github.mikephil.charting.components.XAxis;
import com.github.mikephil.charting.data.BarData;
import com.github.mikephil.charting.data.BarDataSet;
import com.github.mikephil.charting.data.BarEntry;
import com.github.mikephil.charting.formatter.IndexAxisValueFormatter;

import java.util.ArrayList;

public class MainActivity extends AppCompatActivity {

   // Variable for the bar chart
   BarChart barChart;

   // Variables for bar data sets
   BarDataSet barDataSet1, barDataSet2;

   // ArrayList for storing entries
   ArrayList<BarEntry> barEntries;

   // Creating a string array for displaying days
   String[] days = new String[]{"Sunday", "Monday", "Tuesday", "Wednesday", "Thursday", "Friday", "Saturday"};

   @Override
   protected void onCreate(Bundle savedInstanceState) {
      super.onCreate(savedInstanceState);
      setContentView(R.layout.activity_main);

      // Initializing the variable for the bar chart
      barChart = findViewById(R.id.idBarChart);

      // Creating a new bar data set
      barDataSet1 = new BarDataSet(getBarEntriesOne(), "First Set");
      barDataSet1.setColor(getApplicationContext().getResources().getColor(R.color.purple_200));
      barDataSet2 = new BarDataSet(getBarEntriesTwo(), "Second Set");
      barDataSet2.setColor(Color.BLUE);

      // Adding bar data sets to the bar data
      BarData data = new BarData(barDataSet1, barDataSet2);

      // Setting the data to the bar chart
      barChart.setData(data);

      // Removing the description label of the bar chart
      barChart.getDescription().setEnabled(false);

      // Getting the x-axis of the bar chart
      XAxis xAxis = barChart.getXAxis();

      // Setting value formatter to the x-axis
      // and adding the days to the x-axis labels
      xAxis.setValueFormatter(new IndexAxisValueFormatter(days));

      // Setting center axis labels for the bar chart
      xAxis.setCenterAxisLabels(true);

      // Setting the position of the x-axis to bottom
      xAxis.setPosition(XAxis.XAxisPosition.BOTTOM);

      // Setting granularity for the x-axis labels
      xAxis.setGranularity(1);

      // Enabling granularity for the x-axis
      xAxis.setGranularityEnabled(true);

      // Making the bar chart draggable
      barChart.setDragEnabled(true);

      // Setting the visible range for the bar chart
      barChart.setVisibleXRangeMaximum(3);

      // Adding bar space to the chart
      float barSpace = 0.1f;

      // Adding group spacing to the chart
      float groupSpace = 0.5f;

      // Setting the width of the bars
      data.setBarWidth(0.15f);

      // Setting the minimum axis value for the chart
      barChart.getXAxis().setAxisMinimum(0);

      // Animating the chart
      barChart.animate();

      // Grouping bars and adding spacing to them
      barChart.groupBars(0, groupSpace, barSpace);

      // Invalidating the bar chart
      barChart.invalidate();
   }

   // ArrayList for the first set of bar entries
   private ArrayList<BarEntry> getBarEntriesOne() {
      // Creating a new ArrayList
      barEntries = new ArrayList<>();

      // Adding entries to the ArrayList for the first set
      barEntries.add(new BarEntry(1f, 4));
      barEntries.add(new BarEntry(2f, 6));
      barEntries.add(new BarEntry(3f, 8));
      barEntries.add(new BarEntry(4f, 2));
      barEntries.add(new BarEntry(5f, 4));
      barEntries.add(new BarEntry(6f, 1));

      return barEntries;
   }

   // ArrayList for the second set of bar entries
   private ArrayList<BarEntry> getBarEntriesTwo() {
      // Creating a new ArrayList
      barEntries = new ArrayList<>();

      // Adding entries to the ArrayList for the second set
      barEntries.add(new BarEntry(1f, 8));
      barEntries.add(new BarEntry(2f, 12));
      barEntries.add(new BarEntry(3f, 4));
      barEntries.add(new BarEntry(4f, 1));
      barEntries.add(new BarEntry(5f, 7));
      barEntries.add(new BarEntry(6f, 3));

      return barEntries;
   }
}
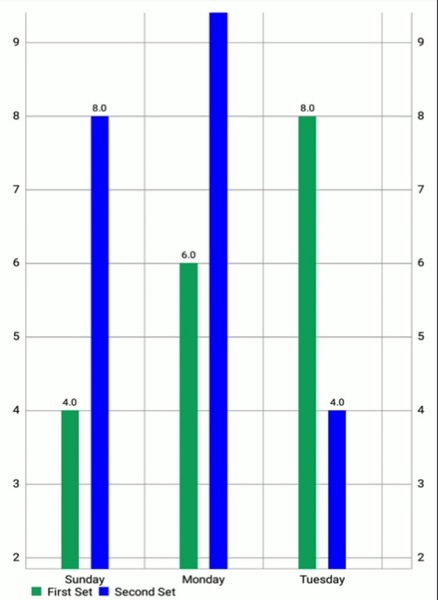
Output
Conclusion
We went over the steps required to construct a Grouped Bar Chart with the MPAndroidChart library throughout the tutorial. We spoke about how to initialise the BarChart, how to prepare the data by generating BarEntry objects for each group, and how to customise the appearance of each group using BarDataSet objects. We then went through how to make the chart data by merging the BarDataSet objects into a BarData object and assigning it to the BarChart.In addition, we stressed the need of refreshing the chart to reflect any changes in the data and offered instructions on how to do so using the invalidate method.

1K+ Views
