
Article Categories
- All Categories
-
 Data Structure
-
 Networking
-
 RDBMS
RDBMS
-
 Operating System
-
 Java
Java
-
 MS Excel
-
 iOS
iOS
-
 HTML
HTML
-
 CSS
CSS
-
 Android
-
 Python
-
 C Programming
-
 C++
C++
-
 C#
C#
-
 MongoDB
-
 MySQL
MySQL
-
 Javascript
-
 PHP
PHP
-
 Economics & Finance
Selected Reading
How to create blue or red colored boxplots in R using ggplot2?
The default color of boxplot area in R using ggplot2 is white but we might want to change that color to something more attracting, for example blue or red. To do this purpose, we can use geom_boxplot function of ggplot2 package with fill argument by passing the color names.
Consider the below data frame −
Example
set.seed(1321)
v1<-sample(rexp(5,1),20,replace=TRUE) v2<-sample(runif(5,1,2),20,replace=TRUE) v3<-sample(rnorm(4,0.95,0.04),20,replace=TRUE)
grp<-rep(LETTERS[1:4],each=5) df<-data.frame(v1,v2,v3,grp)
df
Output
v1 v2 v3 grp
1 0.08498376 1.649463 0.9609699 A
2 5.33122341 1.846499 1.0190320 A
3 0.50680731 1.823257 1.0190320 A
4 0.50680731 1.076741 0.9439942 A
5 5.33122341 1.823257 0.9609699 A
6 0.08498376 1.463174 0.9439942 B
7 0.01242698 1.463174 0.9609699 B
8 0.14391411 1.649463 0.9609699 B
9 0.14391411 1.823257 0.9846460 B
10 0.50680731 1.846499 0.9846460 B
11 5.33122341 1.823257 1.0190320 C
12 0.14391411 1.846499 0.9846460 C
13 0.08498376 1.076741 0.9846460 C
14 5.33122341 1.076741 0.9609699 C
15 0.01242698 1.649463 1.0190320 C
16 0.08498376 1.649463 0.9609699 D
17 0.14391411 1.823257 0.9609699 D
18 0.14391411 1.076741 1.0190320 D
19 0.50680731 1.823257 1.0190320 D
20 0.01242698 1.846499 1.0190320 D
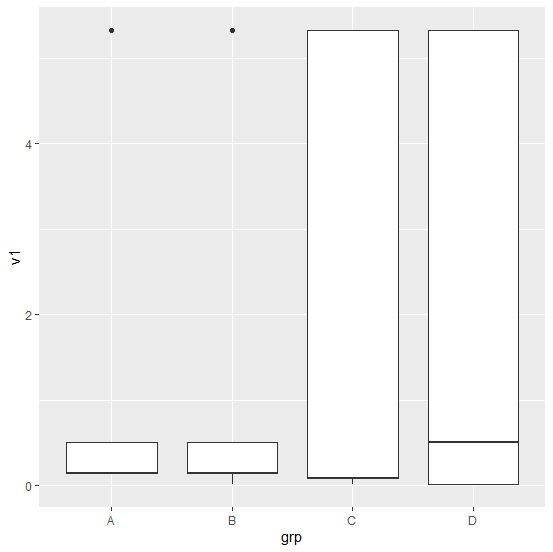
Creating boxplot for v1 based on grp −
ggplot(df,aes(grp,v1))+geom_boxplot()
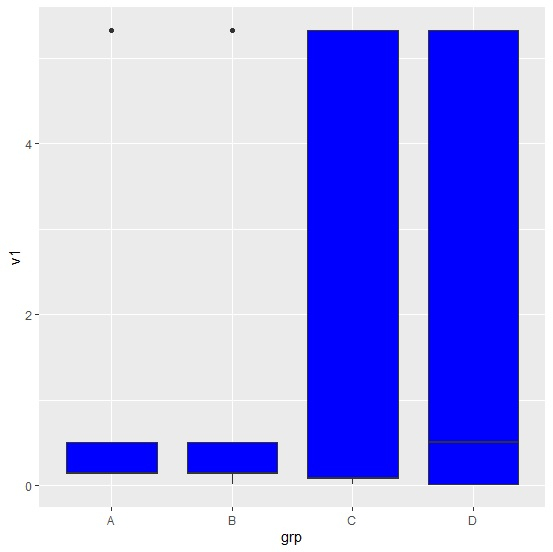
Creating boxplot for v1 based on grp with blue color filled inside the boxplots −
ggplot(df,aes(grp,v1))+geom_boxplot(fill="blue")
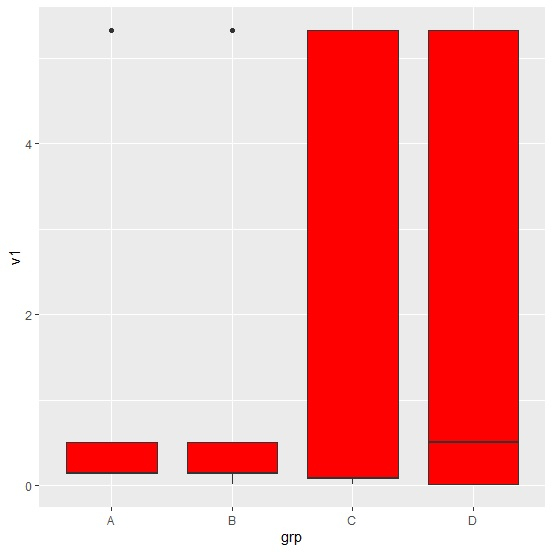
Creating boxplot for v1 based on grp with red color filled inside the boxplots −
Example
ggplot(df,aes(grp,v1))+geom_boxplot(fill="red")
Output

Updated on: 2026-03-11T22:50:52+05:30
311 Views

Advertisements