 Data Structure
 Networking
 RDBMS
RDBMS Operating System
 Java
Java MS Excel
 iOS
iOS HTML
HTML CSS
CSS Android
 Python
 C Programming
 C++
C++ C#
C# MongoDB
 MySQL
MySQL Javascript
 PHP
PHP
- Selected Reading
- UPSC IAS Exams Notes
- Developer's Best Practices
- Questions and Answers
- Effective Resume Writing
- HR Interview Questions
- Computer Glossary
- Who is Who
How to create an ogive graph in python?
An ogive graph graphically represents the cumulative distribution function (CDF) of a set of data, sometimes referred to as a cumulative frequency curve. It is applied to examine data distribution and spot patterns and trends. Matplotlib, Pandas, and Numpy are just a few of the libraries and tools offered by Python to create ogive graphs. In this tutorial, we'll look at how to use Matplotlib to generate an ogive graph in Python.
To create an ogive graph, we need to import the required libraries. In this example, we will use Matplotlib, Pandas, and Numpy. Matplotlib is a popular data visualization library used in Python to create interactive plots and charts. Numpy, on the other hand, is used for performing complex mathematical operations. Pandas is another widely used Python library specifically designed for data manipulation and analysis.
Syntax
plt.plot(*np.histogram(data, bins), 'o-')
In this syntax, ?data' is the dataset to create an ogive graph. The data's frequency distribution is determined by the 'np.histogram' function, which also returns the histogram's values and bin edges. ?plt.plot' is used to create the ogive graph, using the ?'o- '' format string to plot the data points and connect them with lines. Then the ?*' operator unpacks the histogram values and bin edges as separate arguments to ?plt.plot'.
Example
Here's a simple example that creates an ogive graph to visualize the cumulative frequency distribution of a list of dice rolls.
import numpy as np
import matplotlib.pyplot as plt

# List of dice rolls
rolls = [1, 2, 3, 4, 5, 6, 3, 6, 2, 5, 1, 6, 4, 2, 3, 5, 1, 4, 6, 3]

# Calculate the cumulative frequency
bins = np.arange(0, 8, 1)
freq, bins = np.histogram(rolls, bins=bins)
cumulative_freq = np.cumsum(freq)

# Create the ogive graph
plt.plot(bins[1:], cumulative_freq, '-o')
plt.xlabel('Dice Rolls')
plt.ylabel('Cumulative Frequency')
plt.title('Ogive Graph of Dice Rolls')
plt.show()
First, we created an ogive graph to visualize the cumulative frequency distribution of a list of dice rolls which is implemented by importing the necessary modules NumPy and Matplotlib. Then the code defines a list of dice rolls and uses NumPy's histogram function to produce a "histogram" of the data, specifying the number of bins and the range of values the data can take on. Next, the cumulative frequency of the data is represented using NumPy's ?cumsum' function.
Lastly, the cumulative frequency is plotted against the upper bound of each bin to form the ogive graph using Matplotlib's "plot" function. The resulting ogive graph shows the cumulative frequency distribution of the dice rolls, where the x-axis represents the value of the rolls and the y-axis represents the cumulative frequency of those values up to a certain point. This graph can be used to analyze the frequency and distribution of dice rolls.
Output

Example
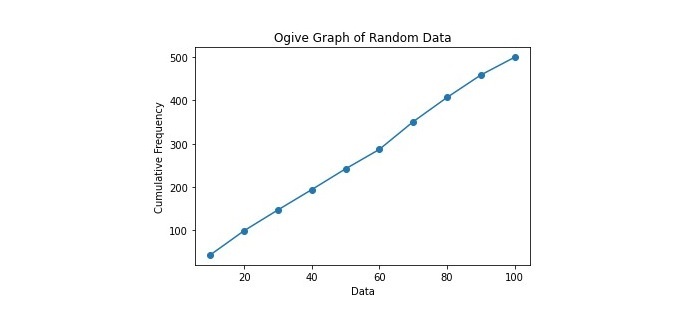
This example demonstrates an ogive graph to visualize a random distribution of 500 numbers between 0 and 100.
import numpy as np
import matplotlib.pyplot as plt

# Generate random data
data = np.random.randint(0, 100, 500)

# Calculate the cumulative frequency
bins = np.arange(0, 110, 10)
freq, bins = np.histogram(data, bins=bins)
cumulative_freq = np.cumsum(freq)

# Create the ogive graph
plt.plot(bins[1:], cumulative_freq, '-o')
plt.xlabel('Data')
plt.ylabel('Cumulative Frequency')
plt.title('Ogive Graph of Random Data')
plt.show()
In this example, we first generate a random dataset of 500 numbers between 0 and 100 using NumPy. The cumulative frequency of the data is then determined using NumPy with a bin width of 10. Lastly, using Matplotlib, we plot the cumulative frequency against the upper bound of each bin to produce the ogive graph. This example demonstrates how to create an ogive graph in Python using randomly generated data.
Output

We learned to create an ogive graph in Python by utilising the Matplotlib module is a simple process using the matplotlib library. By loading your data, calculating the cumulative frequency, and plotting the results, you can easily visualize the distribution of your dataset and identify any patterns or trends. You can customize your graph with labels, titles, and styles to make it more visually appealing and informative. Ogive graphs are useful tools in statistical analysis and can represent a wide range of data, from income distributions to test scores.

