
Article Categories
- All Categories
-
 Data Structure
-
 Networking
-
 RDBMS
RDBMS
-
 Operating System
-
 Java
Java
-
 MS Excel
-
 iOS
iOS
-
 HTML
HTML
-
 CSS
CSS
-
 Android
-
 Python
-
 C Programming
-
 C++
C++
-
 C#
C#
-
 MongoDB
-
 MySQL
MySQL
-
 Javascript
-
 PHP
PHP
-
 Economics & Finance
Create a Cycle Graph using Networkx in Python
A cycle graph is a special kind of graph in which each node has precisely two neighbours and is connected to the others in a complete loop. Cycle graphs may be made quickly and easily with Python's Networkx module. A cycle graph is produced by using the 'networkx.cycle_graph()' function and the number of nodes. This diagram is frequently employed in a variety of applications, including the modelling of periodic phenomena, the representation of circular structures, and the analysis of cyclic processes. It is useful in graph theory and many real-world contexts due to its ease of use and capacity to represent cyclic interactions.
What is NetworkX in Python?
A potent Python package called NetworkX is used to design, examine, and operate with intricate networks or graphs. It provides a large variety of tools and techniques to effectively work with graph structures. Developers and academics can quickly model interactions between items, examine network characteristics, pinpoint important nodes, locate shortest paths, and more with NetworkX. Due to its adaptability, the library is an important resource in a number of fields, including social network analysis, transportation networks, biology, and internet technologies. Python programmers can take on challenging graph-related issues and learn more about the interconnection of data by utilising NetworkX's user-friendly interface and broad features.
Cycle Graph
A cycle graph is a special kind of graph in which every node is connected to exactly two of its neighbours, forming a single closed loop or cycle. There aren't any branches or numerous connections between the nodes in this graph. The cycle creates a circular structure, which serves as a cycle graph's defining feature. It is a basic idea in graph theory that is used frequently to model cyclic or periodic occurrences. Cycle graphs are used in a variety of disciplines, such as chemistry, physics, computer science, and social network research, where it is necessary to display and analyse cyclical interactions and patterns.
Properties
Each node in a cycle graph is connected to exactly two other nodes, creating a closed loop that is devoid of any branches or dead ends.
The symbol for a cycle graph with n nodes is C_n, where n stands for the cycle's total number of nodes.
A cycle graph with n nodes has exactly n edges since each node is joined by an edge to its two next-door neighbours.
A cycle graph C_n has a dimension of floor(n/2). It represents the greatest separation possible between any two graph nodes.
Cycle graphs have two vertex connections and two edge connections, therefore deleting one of the two won't cause the graph to become disconnected.
Cycle graphs have a closed walk that precisely crosses each edge since they are Eulerian graphs.
A Hamiltonian cycle, or a cycle that visits each node precisely once, exists in every cycle graph C_n.
Cycle graphs can be represented on a 2D plane without including any edge crossings because they are planar graphs.
Cycle graphs have rotational symmetry because they maintain their appearance after being rotated by any multiple of 360 degrees.
If n is even, a cycle graph's chromatic number is 2, and if n is odd, it is 3.
Cycle graphs are helpful in many applications and as building blocks in more complicated graph structures due to their simple and well-defined features.
Methods Used
Import Module
Display plot
Import Module
When constructing a Cycle Graph in Python using Networkx, the term "import modules" refers to providing the required libraries in the script to support manipulating and visualising graphs. The "networkx" module specifically offers tools for creating, analysing, and formulating graphs, while the optional "matplotlib.pyplot" module enables graph visualisation. We can construct Cycle Graphs more easily, analyse their properties, and use visualisation techniques to learn more about the structure and relationships of the graph by importing these modules. This improves our comprehension of cyclic patterns and processes in various real-world applications.
Algorithm
nx import "networkx"
You can import "matplotlib.pyplot" as plt to view graphs.
To generate the Cycle Graph, use Networkx's cycle_graph() method.
The cycle_graph() function accepts the input num_nodes, which represents the total number of nodes.
A variable (like cycle_graph) should then be assigned the resulting Cycle Graph object.
Create a layout for the nodes to be attractively displayed if visualisation is desired (for example, pos = nx.circular_layout(cycle_graph)).
Based on the given information and layout, draw the graph using the nx.draw() function.
Set parameters for node labels, colours, and text size if you'd like a better visual representation.
To view the Cycle Graph, use plt.show() to display the graph plot (assuming matplotlib is imported).
Add the required libraries:
Establish a Cycle Graph object:
Graph visualisation (optional):
Return the cycle graph object.
Syntax
import networkx as nx
import matplotlib.pyplot as plt

def create_cycle_graph(num_nodes):
   cycle_graph = nx.cycle_graph(num_nodes)
   return cycle_graph

def visualize_graph(graph):
   pos = nx.circular_layout(graph)
   nx.draw(graph, pos, with_labels=True, node_size=1000, node_color='skyblue',
font_size=10)
   plt.show()

if __name__ == "__main__":
   num_nodes = 5
   cycle_graph = create_cycle_graph(num_nodes)
   visualize_graph(cycle_graph)
Output
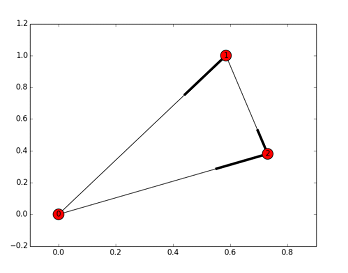
Display Plot
"Display Plot" refers to the process of displaying the graph visualisation on the screen while constructing and visualising a Cycle Graph with Networkx in Python. The Cycle Graph is graphically represented using the 'nx.draw()' function, and the plot is then displayed in an interactive window using the 'plt.show()' command (where 'plt' is'matplotlib.pyplot'). The Cycle Graph can then be viewed, together with its cyclic structure, node connections, and any other pertinent data, by users. It is easier to comprehend and analyse the Cycle Graph's attributes and interactions by using the shown plot as a visual representation of it.
Algorithm
For the generation and visualisation of graphs, import the Networkx and Matplotlib libraries.
You can use the user's input or pre-define a certain number of nodes for the cycle graph.
To construct a Cycle Graph object with the desired amount of nodes, use the nx.cycle_graph() function.
To alter the graph's look, use the nx.draw() function and optional parameters.
To display the graph plot on the screen, use plt.show().
Example
import networkx as nx
import matplotlib.pyplot as plt

num_nodes = int(input("Enter the number of nodes for the Cycle Graph: "))

cycle_graph = nx.cycle_graph(num_nodes)


pos = nx.circular_layout(cycle_graph)
nx.draw(cycle_graph, pos, with_labels=True, node_size=1000,
node_color='skyblue', font_size=10)

plt.show()
Output
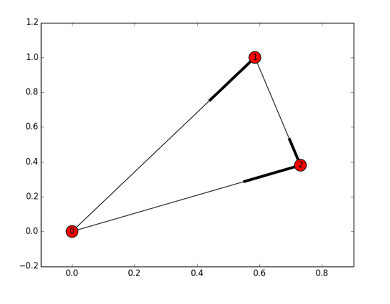
Conclusion
Finally, using Python's Networkx, we were able to correctly generate and display a Cycle Graph. Each node in the Cycle Graph is connected to exactly two neighbours to indicate a closed loop. With the help of Networkx's robust graph-working tools, we can model and analyse a variety of real-world cyclic relationship-related events. Python programmers may examine intricate network structures, locate important nodes, find shortest paths, and more by using Networkx's user-friendly interface and wealth of capabilities. Networkx is a useful tool in graph theory and a variety of application disciplines because the graph's visualisation feature helps to better comprehend the cyclic patterns and interconnections.

946 Views
