
Article Categories
- All Categories
-
 Data Structure
-
 Networking
-
 RDBMS
RDBMS
-
 Operating System
-
 Java
Java
-
 MS Excel
-
 iOS
iOS
-
 HTML
HTML
-
 CSS
CSS
-
 Android
-
 Python
-
 C Programming
-
 C++
C++
-
 C#
C#
-
 MongoDB
-
 MySQL
MySQL
-
 Javascript
-
 PHP
PHP
-
 Economics & Finance
Selected Reading
How to change the color of bars in histogram for values that are greater than 0 or less than 0 in R?
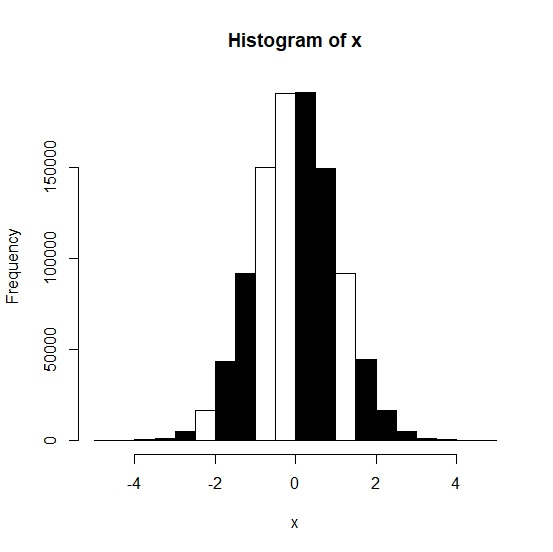
Although, the histogram represents the distribution of a complete set of values but we might want to visualize that histogram based on the division of some threshold value. For example, we might want to visualize the histogram with different bars that have values greater than 1 or less than 1. This will help us to understand the distribution of the values in whole data set that lies above or below certain value. For this purpose, we can simply use hist function with col argument to change the color of the values that are greater than or less than a fixed value.
Example
x<-rnorm(1000000)
hist(x,col=x>0)
Output
Example
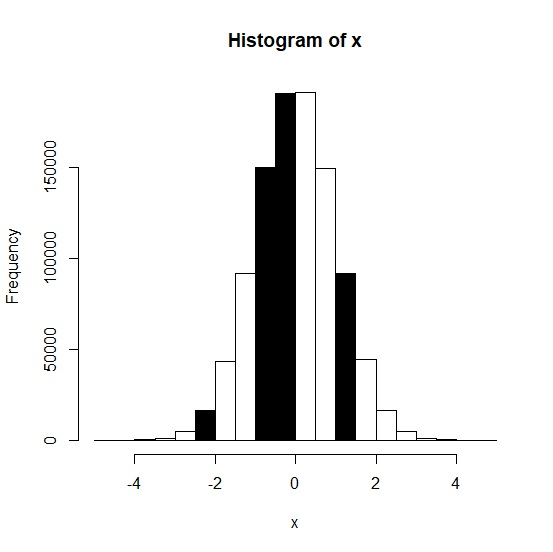
hist(x,col=x<0)
Output

Updated on: 2020-10-14T12:11:11+05:30
369 Views

Advertisements