 Data Structure
 Networking
 RDBMS
RDBMS Operating System
 Java
Java MS Excel
 iOS
iOS HTML
HTML CSS
CSS Android
 Python
 C Programming
 C++
C++ C#
C# MongoDB
 MySQL
MySQL Javascript
 PHP
PHP
- Selected Reading
- UPSC IAS Exams Notes
- Developer's Best Practices
- Questions and Answers
- Effective Resume Writing
- HR Interview Questions
- Computer Glossary
- Who is Who
How to Adjust Marker Size in Matplotlib?
Introduction
In a plot, a marker is a symbol that designates a single data point. Size, color, and shape are just a few of the attributes that may be changed. Markers are commonly used in conjunction with other charting methods to enhance the readability and comprehension of data.
With Matplotlib, a wide variety of marker shapes are provided, including circles, squares, triangles, diamonds, and more. It is possible to alter the marker size to draw attention to crucial details or to develop more aesthetically pleasing plots. We'll show you how to alter the marker size in Matplotlib using examples of Python code in this post.
Syntax
The syntax to adjust marker size in Matplotlib is as follows ?
plt.scatter(x_values, y_values, s=marker_size)
Here, the "s" parameter specifies the marker size.
Algorithm
A general, step-by-step approach for changing marker size in Matplotlib is ?
Import the required libraries.
Establish the x and y values.
Use the s option to choose the size of the marker you want.
Use the plt.scatter() function to plot the data.
Example
import matplotlib.pyplot as plt
import numpy as np

# Set x and y values
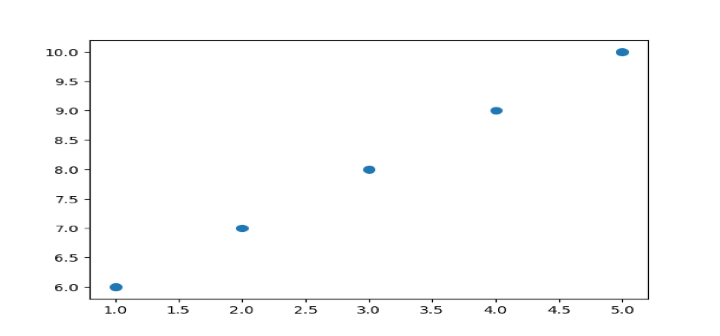
x = np.array([1, 2, 3, 4, 5])
y = np.array([6, 7, 8, 9, 10])

# Set marker size
marker_size = 50

# Plot the data
plt.scatter(x, y, s=marker_size)

# Show the plot
plt.show()

By providing a value to the scatter() function's "s" argument, we can modify the marker size. The size of the markers in the plot is defined in part by the s argument.
To specify a constant marker size across all of the points in the plot, we can set s to a single number. On the other hand, defining the marker size for each point in the plot by supplying an array of values to s.
The scatter() function's c option can be used to modify the color of a marker in Matplotlib.
To set the marker color to a consistent value across all locations in the plot, for instance, we may pass c a single color. As an alternative, we may instruct c to set the marker color for each point in the plot using an array of colors.
For instance, we may use the code plt.scatter(x, y, c='b', s=marker size) to set the marker's color to blue, where 'b' stands for the color blue.
Concept Detail and Examples
Markers are used in Matplotlib to identify particular plot points. The marker size is specified by the s parameter in the plt.scatter() function.
Simply change the value of the s parameter to raise or reduce the marker size. The marker size will be set, for instance, to 50 if s=50.
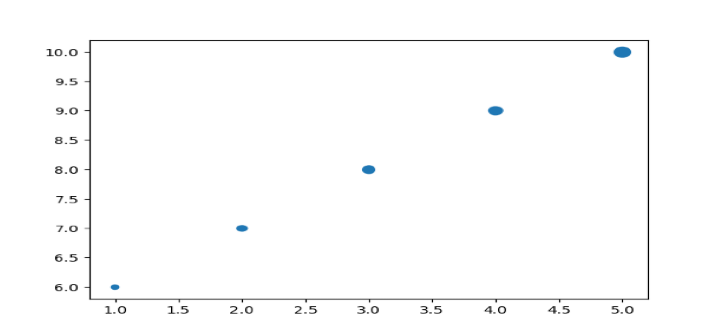
In accordance with the data, you may also change the marker's size. By giving an array of sizes to the s argument, for instance, you may make a scatter plot where the marker size correlates to a third variable.
The sizes array in the example below corresponds to the sizes of the markers. The first point is 20 pixels in size, the second is 40 pixels in size, and so on.
import matplotlib.pyplot as plt
import numpy as np

# Define x, y, and size values
x = np.array([1, 2, 3, 4, 5])
y = np.array([6, 7, 8, 9, 10])
sizes = np.array([20, 40, 60, 80, 100])

# Plot the data with varying marker sizes
plt.scatter(x, y, s=sizes)

# Show the plot
plt.show()

Where is this Useful?
Changing the marker size can be applicable for the the real-world use cases such a ?
Financial data analysis
Scatter plots are frequently used in financial data analysis to compare various stock values over time. A more in-depth and aesthetically pleasing plot may be made by altering the size of the markers based on trade volume or market capitalization. If you want to depict equities with a higher trading volume or market capitalization, for instance, you might use larger markers, and you could use smaller markers to indicate stocks with a lower trading volume or market capitalization.
Medical research
The findings of trials where the x-axis and y-axis indicate several parameters, such as the dosage of a medicine and its impact on a patient's condition, are frequently represented by scatter plots in medical research. It is possible to design a plot that is more educational and aesthetically pleasing by altering the size of the markers in accordance with the sample size or the relevance of the data. Using bigger markers, for instance, to denote studies with a larger sample size or a more significant result, and smaller markers, for experiments with a lower sample size or a less significant result.
Conclusion
Adjusting marker size in Matplotlib is a simple yet useful feature that can help enhance the visual presentation of your data. By using the s parameter in the plt.scatter() function, you can easily adjust the size of your markers. You can also vary the marker size based on a third variable to create more complex and informative plots. With this knowledge, you'll be able to create beautiful and informative data visualizations using Matplotlib.

