
Article Categories
- All Categories
-
 Data Structure
-
 Networking
-
 RDBMS
RDBMS
-
 Operating System
-
 Java
Java
-
 MS Excel
-
 iOS
iOS
-
 HTML
HTML
-
 CSS
CSS
-
 Android
-
 Python
-
 C Programming
-
 C++
C++
-
 C#
C#
-
 MongoDB
-
 MySQL
MySQL
-
 Javascript
-
 PHP
PHP
-
 Economics & Finance
Selected Reading
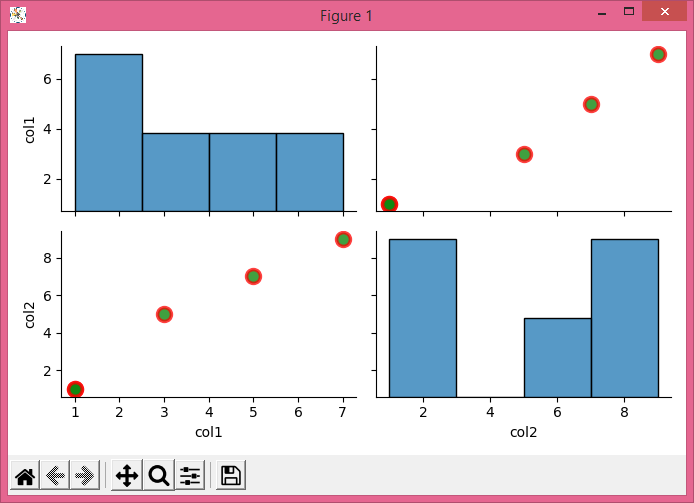
How to adjust transparency (alpha) in Seaborn pairplot using Matplotlib?
To adjust transparency, i.e., aplha in Seaborn pairplot, we can change the value of alpha.
Steps
Create a dataframe using Pandas with two keys, col1 and col2.
Initialize the variable, alpha, for transparency.
Use pairplot() method to plot pairwise relationships in a dataset. Use df (from step 1), kind="scatter", and set the plot size, edgecolor, facecolor, linewidth and alpha vaues in the arguments.
To display the figure, use show() method.
Example
import pandas as pd
import seaborn as sns
from matplotlib import pyplot as plt
plt.rcParams["figure.figsize"] = [7.00, 3.50]
plt.rcParams["figure.autolayout"] = True
df = pd.DataFrame({"col1": [1, 3, 5, 7, 1], "col2": [1, 5, 7, 9, 1]})
alpha = 0.75
sns.pairplot(df, kind="scatter", plot_kws=dict(s=100, edgecolor="red",
   fc='green', linewidth=2.5, alpha=alpha))
plt.show()
Output

Updated on: 2021-05-08T09:15:49+05:30
6K+ Views

Advertisements