
Article Categories
- All Categories
-
 Data Structure
-
 Networking
-
 RDBMS
RDBMS
-
 Operating System
-
 Java
Java
-
 MS Excel
-
 iOS
iOS
-
 HTML
HTML
-
 CSS
CSS
-
 Android
-
 Python
-
 C Programming
-
 C++
C++
-
 C#
C#
-
 MongoDB
-
 MySQL
MySQL
-
 Javascript
-
 PHP
PHP
-
 Economics & Finance
Selected Reading
How to add multiple LineCharts into one Scene/Stage in JavaFX?
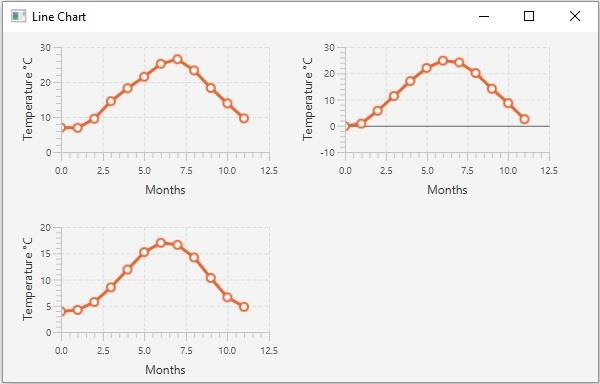
You can create a line chart by instantiating the javafx.scene.chart.LineChart class. Following is an example to create multiple line charts in a single JavaFX window. Here, we are plotting the average temperatures of three different cities in a year.
In this example we have defined a method which accepts the data as double array, creates and returns a Linecart. In the start method we are start() method we have invoked this method with three different data sets and displayed the resultant charts using a FlowPane.
Example
import javafx.application.Application;
import javafx.scene.Scene;
import javafx.stage.Stage;
import javafx.scene.chart.LineChart;
import javafx.scene.chart.NumberAxis;
import javafx.scene.chart.XYChart;
import javafx.scene.layout.FlowPane;
public class MultipleLineCharts extends Application {
   public void start(Stage stage) {
      Double data1[] = {7.0, 6.9, 9.5, 14.5, 18.2, 21.5, 25.2,26.5, 23.3, 18.3, 13.9, 9.6};
      Double data2[] = {-0.2, 0.8, 5.7, 11.3, 17.0, 22.0, 24.8, 24.1, 20.1, 14.1, 8.6, 2.5};
      Double data3[] = {3.9, 4.2, 5.7, 8.5, 11.9, 15.2, 17.0, 16.6, 14.2, 10.3, 6.6, 4.8};
      //Creating a stack pane to hold the chart
      FlowPane pane = new FlowPane(createChart(data1), createChart(data2),
      createChart(data3));
      //Setting the Scene
      Scene scene = new Scene(pane, 595, 350);
      stage.setTitle("Line Chart");
      stage.setScene(scene);
      stage.show();
   }
   public LineChart<Number, Number> createChart(Double[] values) {
      //Creating the X and Y axes
      NumberAxis xAxis = new NumberAxis();
      NumberAxis yAxis = new NumberAxis();
      xAxis.setLabel("Months");
      yAxis.setLabel("Temperature °C");
      //Creating the chart
      LineChart<Number, Number> chart = new LineChart<>(xAxis, yAxis);
      XYChart.Series<Number, Number> series = new LineChart.Series<>();
      series.setName("Average Temperatures");
      //Setting data
      for (int i = 0; i < values.length; i++) {
         XYChart.Data<Number, Number> data = new LineChart.Data<>(i, values[i]);
         series.getData().add(data);
      }
      chart.getData().add(series);
      chart.setPrefSize(280, 180);
      return chart;
   }
   public static void main(String args[]){
      launch(args);
   }
}
Output

Updated on: 2020-05-20T06:45:06+05:30
521 Views

Advertisements