 Data Structure
 Networking
 RDBMS
RDBMS Operating System
 Java
Java MS Excel
 iOS
iOS HTML
HTML CSS
CSS Android
 Python
 C Programming
 C++
C++ C#
C# MongoDB
 MySQL
MySQL Javascript
 PHP
PHP
- Selected Reading
- UPSC IAS Exams Notes
- Developer's Best Practices
- Questions and Answers
- Effective Resume Writing
- HR Interview Questions
- Computer Glossary
- Who is Who
How to Add A Color Picker In Bokeh?
Bokeh is one of the most underrated Python visualization libraries and can be used for various applications, including data analysis, scientific visualization, interactive dashboards, etc. In this blog, we will learn how to add a colorpicker widget in Bokeh.
What's A Color Picker?
Color picker is one of the many widgets present in Bokeh. It helps the user to specify an RGB color value. Widgets add interactions to the graphs, which can then help users to update plots or drive new computations without diving into code. Besides the color picker, Bokeh has many interesting widgets like buttons, checkbox groups, a date picker, data tables, etc.
Getting started with Bokeh
# Installing Bokeh
If you don't have Bokeh installed, use the following pip command to install it.
pip install Bokeh
# Generating Visualization
#import Necessary Bokeh functions for showcasing output inline
from bokeh.layouts import column, row
from bokeh.models import ColorPicker
from bokeh.plotting import figure, show
from bokeh.io import output_notebook
output_notebook()
#generate random data
np.random.seed(1)
#describe the range
x = range(0, 11)
y1 = np.random.randint(1, 10, size=11)
y2 = np.random.randint(1, 10, size=11)
#label the x and y-axis and give them a range
plot = figure(x_axis_label='x', y_axis_label='y', x_range=(0, 11), y_range=(0,10))
#Adding more information such as title name, alignment, and font size
plot.title.text = "Adding color picker in Bokeh"
plot.title.align = "center"
plot.title.text_font_size = "20px"
#note down colors for each line and add label using legend_label
line1 = plot.line(x, y1, color="maroon", legend_label="First")
line2 = plot.line(x, y2, color="blue", legend_label="Second")
#Adding color picker in graph
picker1 = ColorPicker(title="Line 1 Color")
picker1.js_link('color', line1.glyph, 'line_color')
picker1.color='maroon'
picker2 = ColorPicker(title="Line 2 Color")
picker2.js_link('color', line2.glyph, 'line_color')
picker2.color='blue'
#display the plot using Show
show(column(plot, row(picker1, picker2)))
Code explanation
Our code starts with importing NumPy and Bokeh. In addition to Bokeh, we import Colorpicker from Bokeh.models widget module. We also import figures and shows from bokeh.plotting.
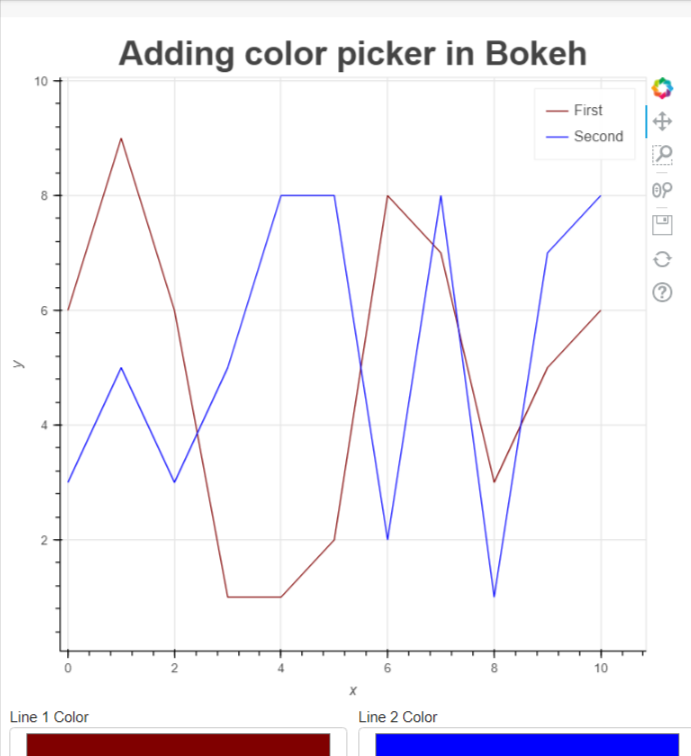
Then we create a basic line chart/plot where we will add our colorpicker. Once the plot is created, we call the ColorPicker class to add the widget. We also specified the initial color of the colorpicker using color function.
And that's it! We've successfully added a color picker widget to our Bokeh plot. When the user selects a new color, the callback function is called, and the color of the scatter plot circles is updated accordingly. This basic framework allows you to customize the plot and callback function to suit your specific needs. Once colorpicker is added, we use the show()function to display the plot.
Output


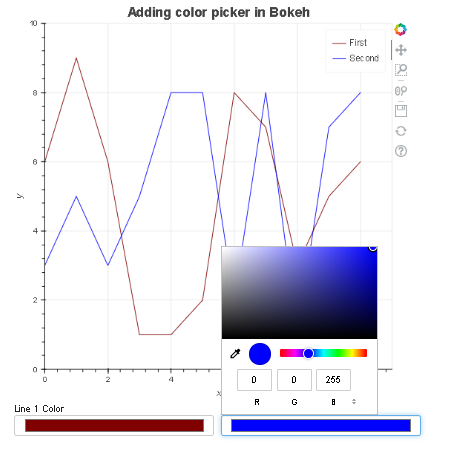
A dropdown will appear by clicking the color picker control, as shown in the image above. Here you can change the color of the line.
Conclusion
Bokeh is an interesting plotting and visualization tool in your toolbox. However, note that it's not a replacement for Matplotlib or seaborn library. Most of the time, you will use Bokeh when you want to create graphical output to explain the abstractions of your code.

