 Data Structure
 Networking
 RDBMS
RDBMS Operating System
 Java
Java MS Excel
 iOS
iOS HTML
HTML CSS
CSS Android
 Python
 C Programming
 C++
C++ C#
C# MongoDB
 MySQL
MySQL Javascript
 PHP
PHP
- Selected Reading
- UPSC IAS Exams Notes
- Developer's Best Practices
- Questions and Answers
- Effective Resume Writing
- HR Interview Questions
- Computer Glossary
- Who is Who
How To Add Color Bar In Bokeh
In Python, Bokeh is one of the most powerful libraries for data visualization that goes beyond traditional plotting. It follows a unique "Grammar of Graphics" architecture that allows developers to build interactive visualizations by managing graphical elements together. A Bokeh plot brings your data to life with its seamless integration with Pandas, NumPy, and SciPy.
What is a Color Bar?
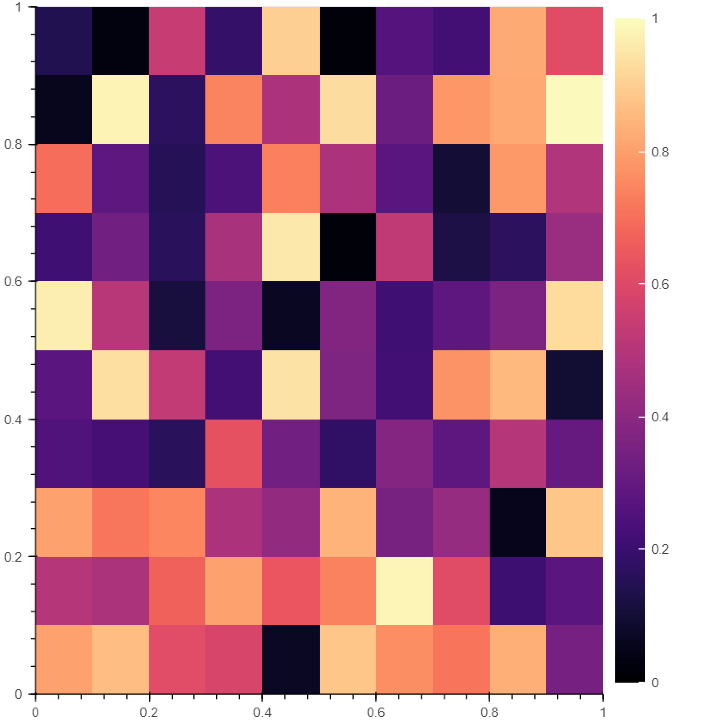
Color bar is a visualization tool where color is used to represent a continuous variable like a heatmap. The main objective of the color bar is to allow users to understand the relationships between data values and the colors used to represent them. Let's learn how to add a color bar in Bokeh.
Step?By?Step Process To Adding ColorBar in Bokeh
Step 1: Import essential libraries
We will import libraries like numpy and bokeh.plotting, bokeh.models, and bokeh.io to create a basic plot. If you use Google Collab or Jupyter notebook, you must use bokeh.io and the output_notebook function to display the plot.
Example
# import NumPy library
import numpy as np

# from bokeh.plot import figure and show for creating and displaying plot
from bokeh.plotting import figure, show

# from bokeh.models import LinearColorMapper and ColorBar to generate a color bar
from bokeh.models import LinearColorMapper, ColorBar
from bokeh.io import output_notebook
output_notebook()
Step 2: Generate or import data to create the plot
We can use the random.rand function of NumPy to generate a random array of desired length
Example
# Generate a random array of size 10 to plot
data = np.random.rand(10,10)
Step 3: Decide the color palette for the color bar
#Choose the bar's color palette using the Linear color mapping function
#Specify the low and high values of the color map to determine the range of values.
color = LinearColorMapper(palette = "Magma256", low = 0, high = 1)
Here, using the palette attribute, we have decided on the color palette of our color bar. We have used Magma256 for our color palette. Still, you can always experiment with other color palettes like Greys256, Inferno256, Plasma256, Viridis256, Cividis256, Turbo256
Step 4: Define the limit of X and Y axis
# Defining X axis and Y axis limits
plot = figure(x_range = (0, 1), y_range = (0,1))
Step 5: Generating image of the plot
#Add the plot's width and height, scalar data, and a color mapper to generate a plot image
plot.image(image = [data], color_mapper = color, dh = [1], dw = [1], x = [0], y = [0])
Step 6: Create the color bar
Use the ColorBar function to create colorbar.
# Creating the color bar and setting the color bar position at (0,0)
color_bar = ColorBar(color_mapper = color, location = (0,0))
Step 7: Position the color bar and display plot
Note that in Bokeh, you can set the colorbar at any position, be it right, left, above, or below. So, it's necessary to mention the position of the colorbar in the code.
# Incorporating the color bar on the right
plot.add_layout(color_bar, 'right')
# display the plot
show(plot)
Output

Conclusion
Color bar is one of the useful tools to correlate relationships between data. Bokeh also gives many more tools to make your charts interactive, like a color picker, add date, tables, etc.

