 Data Structure
 Networking
 RDBMS
RDBMS Operating System
 Java
Java MS Excel
 iOS
iOS HTML
HTML CSS
CSS Android
 Python
 C Programming
 C++
C++ C#
C# MongoDB
 MySQL
MySQL Javascript
 PHP
PHP
- Selected Reading
- UPSC IAS Exams Notes
- Developer's Best Practices
- Questions and Answers
- Effective Resume Writing
- HR Interview Questions
- Computer Glossary
- Who is Who
Hover Text and Formatting in Python-Plotly
Python-Plotly, a widely-used data visualization library, offers various features to enhance visualizations, one such feature is hover text and formatting, which allows users to provide additional information and customize the appearance of tooltips when hovering over data points. Data visualization is a powerful tool for understanding and presenting complex information. In this article, we will explore how to utilize hover text and formatting in Python-Plotly to improve data visualization and convey insights effectively.
How to hover Text and Formatting in Python-Plotly?
Below are examples of how to hover Text and Formatting in Python-Plotly with different hovermodes.
Default hovermode
Follow the steps given below for Default hovermode and custom hovertemplate ?
Import the necessary libraries, including Plotly Express.
Load the inbuilt dataset iris from Plotly Express, which contains information about iris flowers.
Create a scatter plot using px.scatter.
Specify the dataset (df) and map the columns sepal_width and sepal_length to the x and y axes, respectively.
Use the color parameter to differentiate the data points based on the species column.
To include additional information in the hover text, we use the hover_data parameter to specify the columns petal_length and petal_width.
Set the hover_name parameter to "species" so that the species name appears in the hover text as well.
Customize the hover text and formatting by updating the traces using fig.update_traces. We set the hovertemplate attribute to format the hover text, using placeholders %{x}, %{y}, %{text}, and %{customdata[1]} to display the values from the respective columns.
Set the text attribute to provide the hover text for the y-axis, using a list comprehension to repeat the formatted petal length value for each data point.
Display the plot using fig.show().
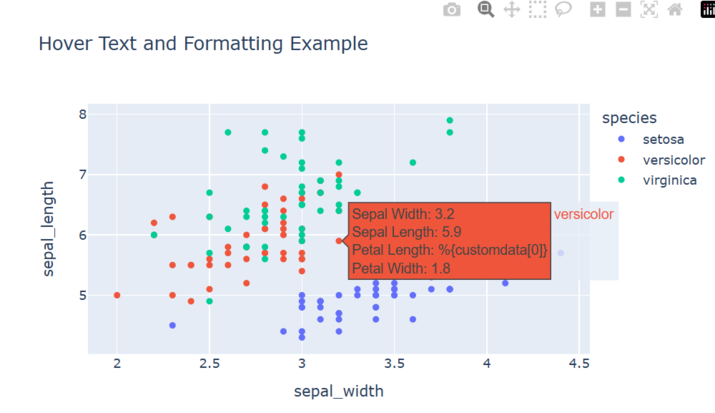
By default, the value of the attribute hovermode is "closest".
Example
import plotly.express as px
# Load the inbuilt dataset
df = px.data.iris()

# Create the scatter plot
fig = px.scatter(df, x="sepal_width", y="sepal_length", color="species",
   hover_data=["petal_length", "petal_width"],
   hover_name="species",
   title="Hover Text and Formatting Example")

# Customize hover text and formatting for the y-axis
fig.update_traces(hovertemplate="Sepal Width: %{x}<br>Sepal Length: %{y}<br>%{text}<br>Petal Width: %{customdata[1]}",
   text=["Petal Length: %{customdata[0]}"] * len(df))
fig.update_layout(hovermode="closest")

# Show the plot
fig.show()
Output

When you run this program, you should see a scatter plot of sepal width versus sepal length, with points colored based on species. When you hover over a point, the hover text will display the sepal width, sepal length, petal length, and petal width for that data point. The y-axis hover text will display the formatted sepal length value for each data point.
Y- unified hovermode
Follow the steps given below for Y-unified hovermode and custom hovertemplate ?
Import the necessary libraries, including Plotly Express.
Load the inbuilt dataset iris from Plotly Express, which contains information about iris flowers.
Create a scatter plot using px.scatter.
Specify the dataset (df) and map the columns sepal_width and sepal_length to the x and y axes, respectively.
Use the color parameter to differentiate the data points based on the species column.
To include additional information in the hover text, we use the hover_data parameter to specify the columns petal_length and petal_width.
Set the hover_name parameter to "species" so that the species name appears in the hover text as well.
Customize the hover text and formatting by updating the traces using fig.update_traces. We set the hovertemplate attribute to format the hover text, using placeholders %{x}, %{y}, %{text}, and %{customdata[1]} to display the values from the respective columns.
Set the text attribute to provide the hover text for the y-axis, using a list comprehension to repeat the formatted petal length value for each data point.
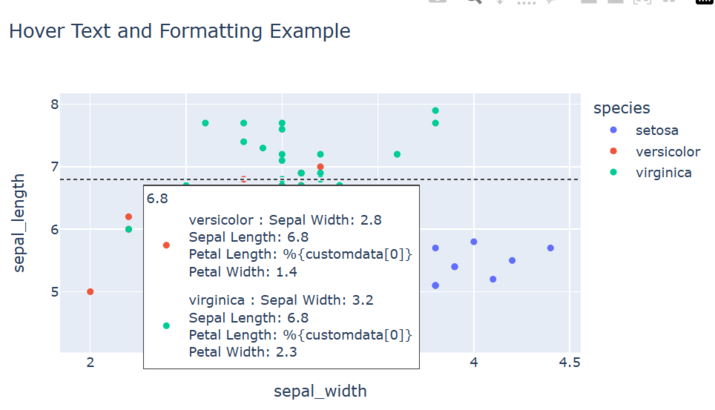
Use the method fig.update_layout() and set the hovermode attribute to y unified.
Display the plot using fig.show().
Example
import plotly.express as px

# Load the inbuilt dataset
df = px.data.iris()

# Create the scatter plot
fig = px.scatter(df, x="sepal_width", y="sepal_length", color="species",
   hover_data=["petal_length", "petal_width"],
   hover_name="species",
   title="Hover Text and Formatting Example")

# Customize hover text and formatting for the y-axis
fig.update_traces(hovertemplate="Sepal Width: %{x}<br>Sepal Length: %{y}<br>%{text}<br>Petal Width: %{customdata[1]}",
                  text=["Petal Length: %{customdata[0]}"] * len(df))
fig.update_layout(hovermode="y unified")

# Show the plot
fig.show()
Output

X- unified hovermode
Follow the steps given below for X-unified hovermode and custom hovertemplate ?
Import the necessary libraries, including Plotly Express.
Load the inbuilt dataset iris from Plotly Express, which contains information about iris flowers.
Create a scatter plot using px.scatter.
Specify the dataset (df) and map the columns sepal_width and sepal_length to the x and y axes, respectively.
Use the color parameter to differentiate the data points based on the species column.
To include additional information in the hover text, we use the hover_data parameter to specify the columns petal_length and petal_width.
Set the hover_name parameter to "species" so that the species name appears in the hover text as well.
Customize the hover text and formatting by updating the traces using fig.update_traces. We set the hovertemplate attribute to format the hover text, using placeholders %{x}, %{y}, %{text}, and %{customdata[1]} to display the values from the respective columns.
Set the text attribute to provide the hover text for the y-axis, using a list comprehension to repeat the formatted petal length value for each data point.
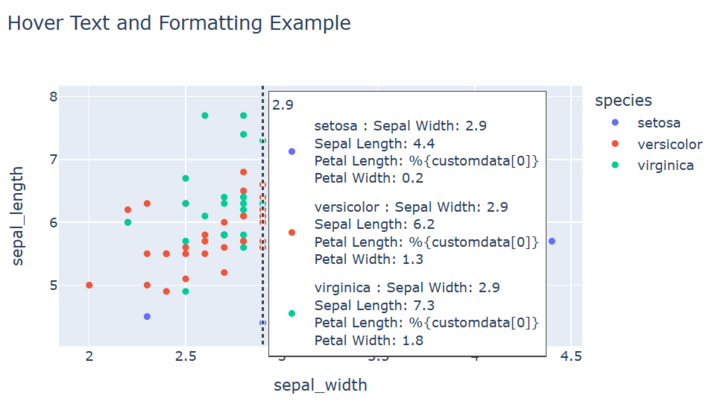
Use the method fig.update_layout() and set the hovermode attribute to x unified.
Display the plot using fig.show().
Example
import plotly.express as px

# Load the inbuilt dataset
df = px.data.iris()

# Create the scatter plot
fig = px.scatter(df, x="sepal_width", y="sepal_length", color="species",
   hover_data=["petal_length", "petal_width"],
   hover_name="species",
   title="Hover Text and Formatting Example")

# Customize hover text and formatting for the y-axis
fig.update_traces(hovertemplate="Sepal Width: %{x}<br>Sepal Length: %{y}<br>%{text}<br>Petal Width: %{customdata[1]}",
   text=["Petal Length: %{customdata[0]}"] * len(df))
fig.update_layout(hovermode="x unified")

# Show the plot
fig.show()
Output

Conclusion
In conclusion, hover text and formatting in Python-Plotly offer a seamless way to enhance data visualization. By providing additional context and customizing the appearance of tooltips, users can effectively communicate insights and improve data comprehension. The interactive nature of hover text adds depth and engagement to visualizations, making them more informative and user-friendly. With Python-Plotly's powerful features, data analysts and visualization designers can create visually appealing and interactive plots that effectively convey information.

