 Data Structure
 Networking
 RDBMS
RDBMS Operating System
 Java
Java MS Excel
 iOS
iOS HTML
HTML CSS
CSS Android
 Python
 C Programming
 C++
C++ C#
C# MongoDB
 MySQL
MySQL Javascript
 PHP
PHP
- Selected Reading
- UPSC IAS Exams Notes
- Developer's Best Practices
- Questions and Answers
- Effective Resume Writing
- HR Interview Questions
- Computer Glossary
- Who is Who
Histogram Plotting and stretching in Python
Histogram plotting and stretching is a powerful tool in data visualization and scaling that allows you to represent the distribution of a numerical variable and spread out over a full range of values in the dataset of the histogram. This process can be useful in improving the contrast of an image or in improving the visibility of data in a histogram.
A histogram is a graphical representation of the distribution of the frequency of the dataset. It can visualize the underlying distribution of the probability of a set of continuous data. In this article, we will discuss how we can create and stretch histograms in Python by using inbuilt functions and then without using inbuilt functions.
Histogram plotting and stretching in Python (using inbuilt functions)
Follow the steps given below to plot and stretch a histogram using inbuilt functions of matplotlib and OpenCV, it also shows RGB channels ?
First load the input image using the cv2.imread function
Split the channels into red, green, and blue using the cv2.split function
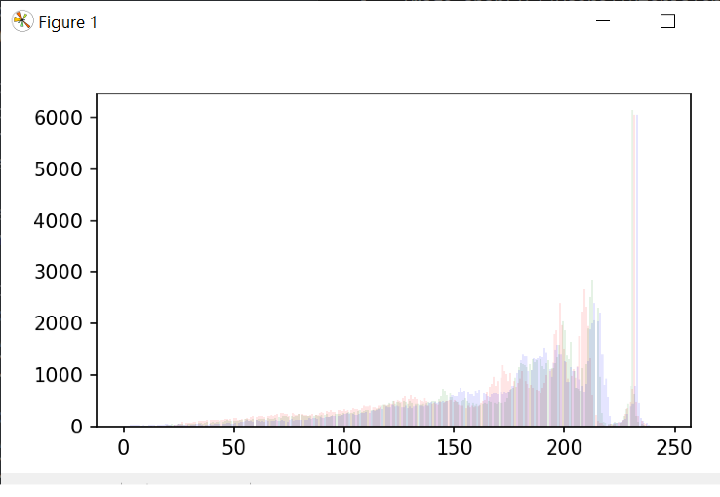
Then plot the histograms for each channel using the plt.hist function from the matplotlib library.
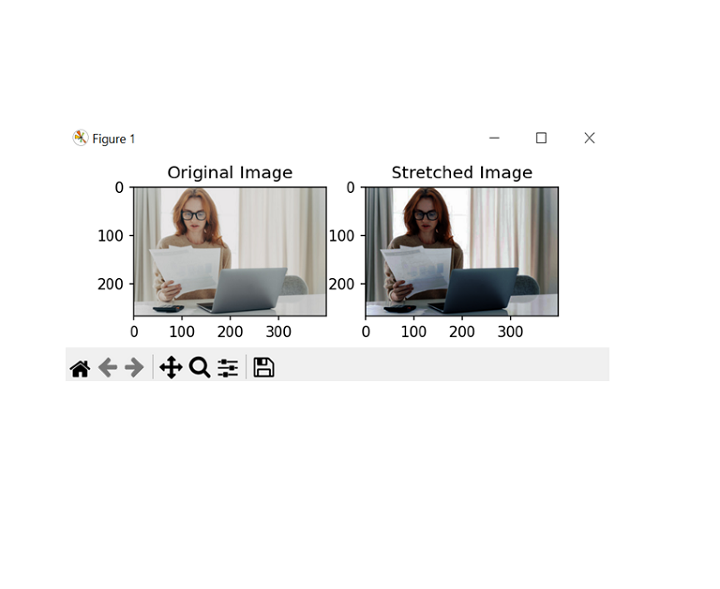
Stretch the contrast of each channel using the cv2.equalizeHist function.
Merge the channels back together using the cv2.merge function.
Display the side of the original and stretched image by side using the plt.imshow function and the subplots function from the matplotlib library.
Note ? Stretching the contrast of an image can result in changes to its overall appearance, so it is necessary to be careful while evaluating the results to make sure they meet the desired goals.
Given below is the example program for histogram plotting and stretching in Python. In this program, we will assume that the input image has RGB channels. If the image has a different color space, additional steps may be required to properly handle the color channels.
Example
import cv2
import numpy as np
import matplotlib.pyplot as pltt

# Load the input image with RGB channels
img_sam = cv2.imread('sample.jpg', cv2.IMREAD_COLOR)

# Split the channels into red, green, and blue
rd, gn, bl = cv2.split(img_sam)

# Plot the histograms for each channel
pltt.hist(rd.ravel(), bins=277, color='red', alpha=0.10)
pltt.hist(gn.ravel(), bins=277, color='green', alpha=0.10)
pltt.hist(bl.ravel(), bins=277, color='blue', alpha=0.10)
pltt.show()

# Stretch the contrast for each channel
red_c_stretch = cv2.equalizeHist(rd)
green_c_stretch = cv2.equalizeHist(gn)
blue_c_stretch = cv2.equalizeHist(bl)

# Merge the channels back together
img_stretch = cv2.merge((red_c_stretch, green_c_stretch, blue_c_stretch))

# Display the original and stretched images side by side
pltt.subplot(121)
pltt.imshow(cv2.cvtColor(img_sam, cv2.COLOR_BGR2RGB))
pltt.title('Original_Image')

pltt.subplot(122)
pltt.imshow(cv2.cvtColor(img_stretch, cv2.COLOR_BGR2RGB))
pltt.title('Stretched_Image')

pltt.show()
Output


Histogram plotting and stretching in Python (without using inbuilt functions)
Follow the steps given below for histogram plotting and stretching in Python with RGB channels without using inbuilt functions.
Load the input image using the cv2.imread function.
Split the channels into red, green, and blue using array slicing.
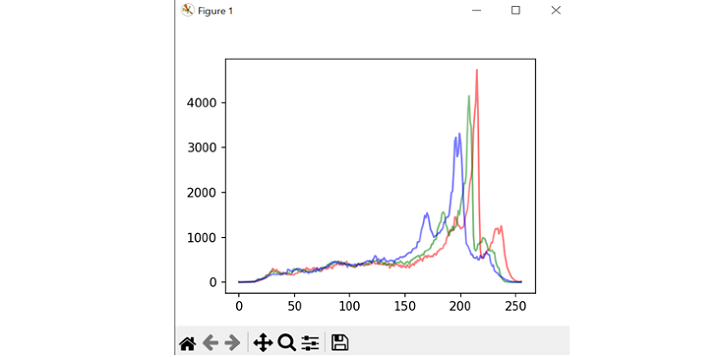
Calculate the histograms for each channel using a nested loop and the np.zeros function to initialize an array with zeros.
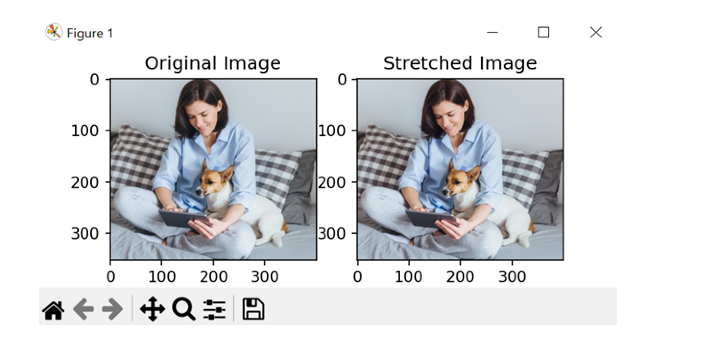
Stretch the contrast of each channel by finding the minimum and maximum values in each channel and applying a linear transformation to scale the pixel values to the full range of 0-255.
For the above step use nested loop and the np.uint8 data type to ensure that the pixel values stay within the range of 0-255.
Merge the channels back together using the cv2.merge function.
Display the side of the original and stretched image by side using the plt.imshow function and the subplots function from the matplotlib library.
Below is the program example to do the same ?
Note ? Below program assumes that the input image has RGB channels and that the pixel values are reperesented as 8-bit integers. If the image has a different color space or data type , additional steps may be required to properly evaluate the results.
Example
import cv2
import numpy as np
import matplotlib.pyplot as pltt

# Load the input image
img = cv2.imread('sample2.jpg', cv2.IMREAD_COLOR)

# Split the image into color channels
r, g, b = img[:,:,0], img[:,:,1], img[:,:,2]

# Plot the histograms for each channel
hist_r = np.zeros(256)
hist_g = np.zeros(256)
hist_b = np.zeros(256)

for i in range(img.shape[0]):
    for j in range(img.shape[1]):
      hist_r[r[i,j]] += 1
      hist_g[g[i,j]] += 1
      hist_b[b[i,j]] += 1

pltt.plot(hist_r, color='red', alpha=0.10)
pltt.plot(hist_g, color='green', alpha=0.10)
pltt.plot(hist_b, color='blue', alpha=0.10)
pltt.show()

# Stretch the contrast for each channel
min_r, max_r = np.min(r), np.max(r)
min_g, max_g = np.min(g), np.max(g)
min_b, max_b = np.min(b), np.max(b)

re_stretch = np.zeros((img.shape[0], img.shape[1]), dtype=np.uint8)
gr_stretch = np.zeros((img.shape[0], img.shape[1]), dtype=np.uint8)
bl_stretch = np.zeros((img.shape[0], img.shape[1]), dtype=np.uint8)

for i in range(img.shape[0]):
   for j in range(img.shape[1]):
      re_stretch[i,j] = int((r[i,j] - min_r) * 255 / (max_r - min_r))
      gr_stretch[i,j] = int((g[i,j] - min_g) * 255 / (max_g - min_g))
      bl_stretch[i,j] = int((b[i,j] - min_b) * 255 / (max_b - min_b))

# Merge the channels back together
img_stretch = cv2.merge((re_stretch, gr_stretch, bl_stretch))

# Display the original and stretched images side by side
pltt.subplot(121)
pltt.imshow(cv2.cvtColor(img, cv2.COLOR_BGR2RGB))
pltt.title('Original Image')

pltt.subplot(122)
pltt.imshow(cv2.cvtColor(img_stretch, cv2.COLOR_BGR2RGB))
pltt.title('Stretched Image')

pltt.show()
Output


Conclusion
In conclusion, Histogram plotting and stretching in Python is a very useful method for improving the contrast of digital images. We can visualize the distribution of pixel values and identify areas of low contrast by plotting histogram color channels. We learned that we can even increase the dynamic range of the image and bring out details that may have been hidden by stretching the contrast using linear transformation.

