- ggplot2 - Home
- ggplot2 - Introduction
- ggplot2 - Installation of R
- ggplot2 - Default Plot in R
- ggplot2 - Working with Axes
- ggplot2 - Working with Legends
- ggplot2 - Scatter Plots & Jitter Plots
- ggplot2 - Bar Plots & Histograms
- ggplot2 - Pie Charts
- ggplot2 - Marginal Plots
- ggplot2 - Bubble Plots & Count Charts
- ggplot2 - Diverging Charts
- ggplot2 - Themes
- ggplot2 - Multi Panel Plots
- ggplot2 - Multiple Plots
- ggplot2 - Background Colors
- ggplot2 - Time Series
- ggplot2 Useful Resources
- ggplot2 - Quick Guide
- ggplot2 - Useful Resources
- ggplot2 - Discussion
ggplot2 - Multi Panel Plots
Multi panel plots mean plot creation of multiple graphs together in a single plot. We will use par() function to put multiple graphs in a single plot by passing graphical parameters mfrow and mfcol.
Here we will use AirQuality dataset to implement multi panel plots. Let us understand the dataset first to have a look on creation of multi panel plots. This dataset includes Contains the responses of a gas multi-sensor device deployed on the field in an Italian city. Hourly responses averages are recorded along with gas concentrations references from a certified analyzer.
Insight of par() function
Understand the par() function to create a dimension of required multi panel plots.
> par(mfrow=c(1,2))
> # set the plotting area into a 1*2 array
This creates a blank plot with dimension of 1*2.

Now create the bar plot and pie chart of the mentioned dataset using following command. This same phenomenon can be achieved with the graphical parameter mfcol.
Creating Multi Panel Plots
The only difference between the two is that, mfrow fills in the subplot region row wise while mfcol fills it column wise.
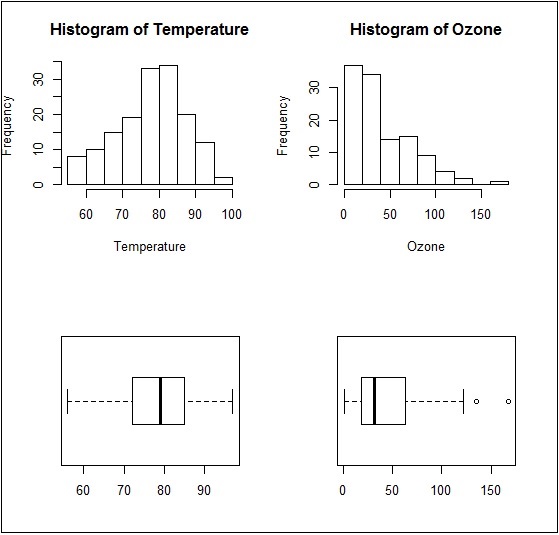
> Temperature <- airquality$Temp
> Ozone <- airquality$Ozone
> par(mfrow=c(2,2))
> hist(Temperature)
> boxplot(Temperature, horizontal=TRUE)
> hist(Ozone)
> boxplot(Ozone, horizontal=TRUE)
The boxplots and barplots are created in single window basically creating a multi panel plots.
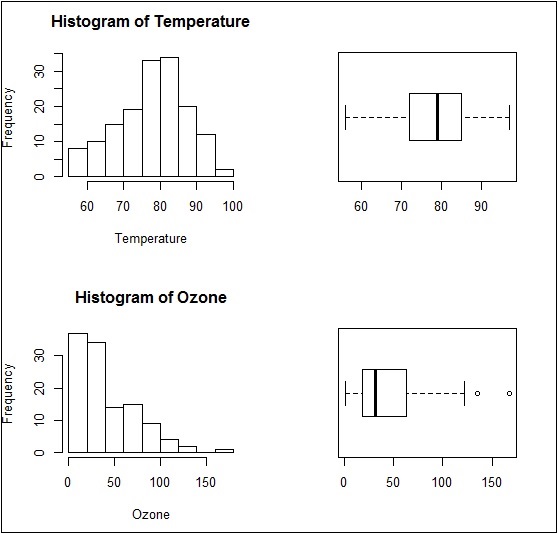
Same plot with a change of dimensions in par function would look as follows −
par(mfcol = c(2, 2))