
 Data Structure
 Networking
 RDBMS
RDBMS Operating System
 Java
Java MS Excel
 iOS
iOS HTML
HTML CSS
CSS Android
 Python
 C Programming
 C++
C++ C#
C# MongoDB
 MySQL
MySQL Javascript
 PHP
PHP
- Selected Reading
- UPSC IAS Exams Notes
- Developer's Best Practices
- Questions and Answers
- Effective Resume Writing
- HR Interview Questions
- Computer Glossary
- Who is Who
How can axis aligned rectangles be visualized using Python and Bokeh?
Bokeh is a Python package that helps in data visualization. It is an open source project. Bokeh renders its plot using HTML and JavaScript. This indicates that it is useful while working with web-based dashboards.
Bokeh converts the data source into a JSON file. This file is used as an input to BokehJS, which is a JavaScript library. This BokehJS is written in TypeScript that helps render visualization on modern browsers.
Matplotlib and Seaborn produce static plots, whereas Bokeh produces interactive plots. This means when the user interacts with these plots, they change accordingly.
Plots can be embedded as output of Flask or Django enabled web applications. Jupyter notebook can also be used to render these plots.
Dependencies of Bokeh −
Numpy
Pillow
Jinja2
Packaging
Pyyaml
Six
Tornado
Python−dateutil
Installation of Bokeh on Windows command prompt
pip3 install bokeh
Installation of Bokeh on Anaconda prompt
conda install bokeh
The axis aligned rectangles are also known as ‘quads’, which can be drawn by specifying the left, right, top and bottom positions using the ‘quad’ function, which is a glyph function.
Following is an example −
Example
from bokeh.plotting import figure, output_file, show

output_file('alignedRect.html')

p = figure(plot_width=500, plot_height=300)
p.quad(top=[5, 8, 3, 0], bottom=[1, 2, 3, 9], left=[1, 2, 3,9],
   right=[1.5, 2.2, 3.9], color="#B3DE69")
show(p)
Output
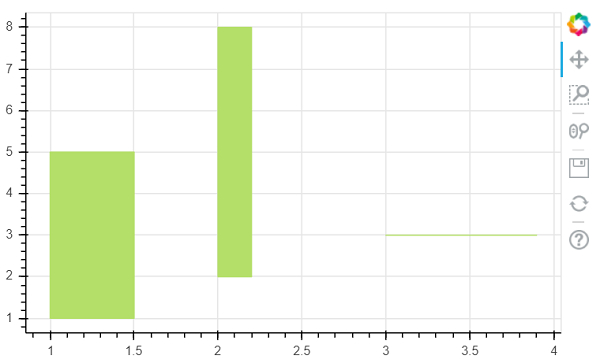
Explanation
The required packages are imported, and aliased.
The figure function is called along with plot width and height.
The ‘output_file’ function is called to mention the name of the html file that will be generated.
The ‘rect’ function present in Bokeh is called, along with data.
The ‘show’ function is used to display the plot.

239 Views
