
Article Categories
- All Categories
-
 Data Structure
-
 Networking
-
 RDBMS
RDBMS
-
 Operating System
-
 Java
Java
-
 MS Excel
-
 iOS
iOS
-
 HTML
HTML
-
 CSS
CSS
-
 Android
-
 Python
-
 C Programming
-
 C++
C++
-
 C#
C#
-
 MongoDB
-
 MySQL
MySQL
-
 Javascript
-
 PHP
PHP
-
 Economics & Finance
How can patch plot with multiple patches be visualized in Bokeh?
Bokeh is a Python package that helps in data visualization. It is an open source project. Bokeh renders its plot using HTML and JavaScript. This indicates that it is useful while working with web-based dashboards.
Bokeh can be easily used in conjunction with NumPy, Pandas, and other Python packages. It can be used to produce interactive plots, dashboards, and so on. It helps in communicating the quantitative insights to the audience effectively.
Matplotlib and Seaborn produce static plots, whereas Bokeh produces interactive plots. This means when the user interacts with these plots, they change accordingly.
Plots can be embedded as output of Flask or Django enabled web applications. Jupyter notebook can also be used to render these plots.
Dependencies of Bokeh −
Numpy
Pillow
Jinja2
Packaging
Pyyaml
Six
Tornado
Python−dateutil
Installation of Bokeh on Windows command prompt
pip3 install bokeh
Installation of Bokeh on Anaconda prompt
conda install bokeh
Example
from bokeh.plotting import figure, output_file, show
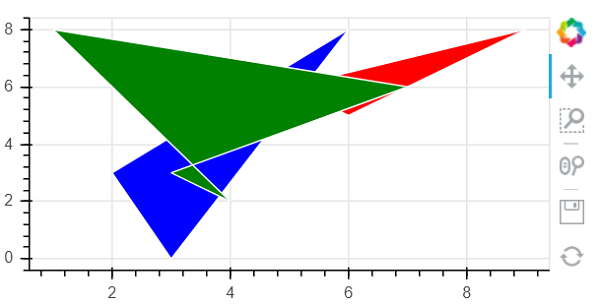
xs = [[5, 6, 9], [2,3,6], [4, 3, 7, 1]]
ys = [[6, 5, 8], [3,0,8], [2, 3, 6, 8]]
fig = figure(plot_width = 400, plot_height = 200)
fig.patches(xs, ys, fill_color = ['red', 'blue', 'green'], line_color = 'white')
output_file('patchplot.html')
show(fig)
Output
Explanation
The required packages are imported, and aliased.
The figure function is called.
The ‘output_file’ function is called to mention the name of the html file that will be generated.
The data is defined as a list of lists.
The width and height of the plot are defined within the ‘figure’ function.
The ‘patches’ function present in Bokeh is called.
The ‘show’ function is used to display the plot.

309 Views
