- DIP - Home
- DIP - Image Processing Introduction
- DIP - Signal and System Introduction
- DIP - History of Photography
- DIP - Applications and Usage
- DIP - Concept of Dimensions
- DIP - Image Formation on Camera
- DIP - Camera Mechanism
- DIP - Concept of Pixel
- DIP - Perspective Transformation
- DIP - Concept of Bits Per Pixel
- DIP - Types of Images
- DIP - Color Codes Conversion
- DIP - Grayscale to RGB Conversion
- DIP - Concept of Sampling
- DIP - Pixel Resolution
- DIP - Concept of Zooming
- DIP - Zooming methods
- DIP - Spatial Resolution
- DIP - Pixels Dots and Lines per inch
- DIP - Gray Level Resolution
- DIP - Concept of Quantization
- DIP - ISO Preference curves
- DIP - Concept of Dithering
- DIP - Histograms Introduction
- DIP - Brightness and Contrast
- DIP - Image Transformations
- DIP - Histogram Sliding
- DIP - Histogram Stretching
- DIP - Introduction to Probability
- DIP - Histogram Equalization
- DIP - Gray Level Transformations
- DIP - Concept of convolution
- DIP - Concept of Masks
- DIP - Concept of Blurring
- DIP - Concept of Edge Detection
- DIP - Prewitt Operator
- DIP - Sobel operator
- DIP - Robinson Compass Mask
- DIP - Krisch Compass Mask
- DIP - Laplacian Operator
- DIP - Frequency Domain Analysis
- DIP - Fourier series and Transform
- DIP - Convolution theorm
- DIP - High Pass vs Low Pass Filters
- DIP - Introduction to Color Spaces
- DIP - JPEG compression
- DIP - Optical Character Recognition
- DIP - Computer Vision and Graphics
Digital Image Processing - Histograms Introduction
Before discussing the use of Histograms in image processing, we will first look at what histogram is, how it is used and then an example of histograms to have more understanding of histogram.
Histograms
A histogram is a graph. A graph that shows frequency of anything. Usually histogram have bars that represent frequency of occurring of data in the whole data set.
A Histogram has two axis the x axis and the y axis.
The x axis contains event whose frequency you have to count.
The y axis contains frequency.
The different heights of bar shows different frequency of occurrence of data.
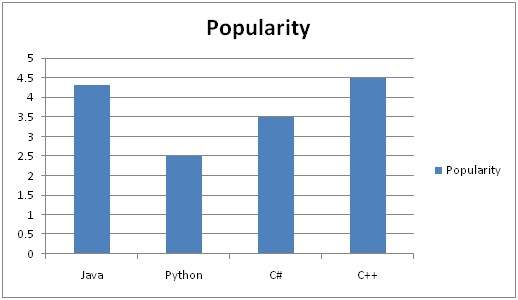
Usually a histogram looks like this.
Now we will see an example of this histogram is build
Example
Consider a class of programming students and you are teaching python to them.
At the end of the semester, you got this result that is shown in table. But it is very messy and does not show your overall result of class. So you have to make a histogram of your result, showing the overall frequency of occurrence of grades in your class. Here how you are going to do it.
Result sheet
| Name | Grade |
|---|---|
| John | A |
| Jack | D |
| Carter | B |
| Tommy | A |
| Lisa | C+ |
| Derek | A- |
| Tom | B+ |
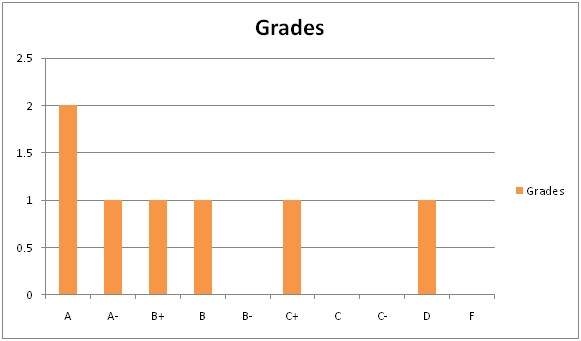
Histogram of result sheet
Now what you are going to do is, that you have to find what comes on the x and the y axis.
There is one thing to be sure, that y axis contains the frequency, so what comes on the x axis. X axis contains the event whose frequency has to be calculated. In this case x axis contains grades.
Now we will how do we use a histogram in an image.
Histogram of an Image
Histogram of an image, like other histograms also shows frequency. But an image histogram, shows frequency of pixels intensity values. In an image histogram, the x axis shows the gray level intensities and the y axis shows the frequency of these intensities.
Example
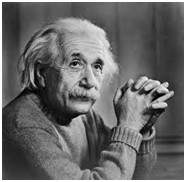
The histogram of the above picture of the Einstein would be something like this
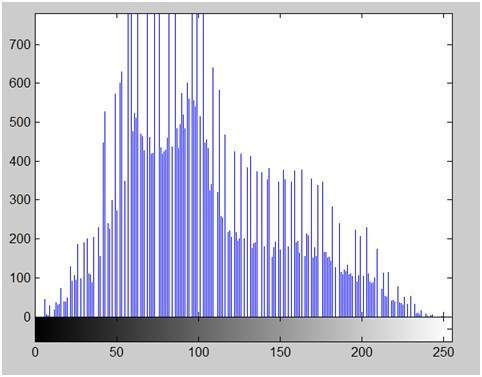
The x axis of the histogram shows the range of pixel values. Since its an 8 bpp image, that means it has 256 levels of gray or shades of gray in it. Thats why the range of x axis starts from 0 and end at 255 with a gap of 50. Whereas on the y axis, is the count of these intensities.
As you can see from the graph, that most of the bars that have high frequency lies in the first half portion which is the darker portion. That means that the image we have got is darker. And this can be proved from the image too.
Applications of Histograms
Histograms has many uses in image processing. The first use as it has also been discussed above is the analysis of the image. We can predict about an image by just looking at its histogram. Its like looking an x ray of a bone of a body.
The second use of histogram is for brightness purposes. The histograms has wide application in image brightness. Not only in brightness, but histograms are also used in adjusting contrast of an image.
Another important use of histogram is to equalize an image.
And last but not the least, histogram has wide use in thresholding. This is mostly used in computer vision.