- DIP - Home
- DIP - Image Processing Introduction
- DIP - Signal and System Introduction
- DIP - History of Photography
- DIP - Applications and Usage
- DIP - Concept of Dimensions
- DIP - Image Formation on Camera
- DIP - Camera Mechanism
- DIP - Concept of Pixel
- DIP - Perspective Transformation
- DIP - Concept of Bits Per Pixel
- DIP - Types of Images
- DIP - Color Codes Conversion
- DIP - Grayscale to RGB Conversion
- DIP - Concept of Sampling
- DIP - Pixel Resolution
- DIP - Concept of Zooming
- DIP - Zooming methods
- DIP - Spatial Resolution
- DIP - Pixels Dots and Lines per inch
- DIP - Gray Level Resolution
- DIP - Concept of Quantization
- DIP - ISO Preference curves
- DIP - Concept of Dithering
- DIP - Histograms Introduction
- DIP - Brightness and Contrast
- DIP - Image Transformations
- DIP - Histogram Sliding
- DIP - Histogram Stretching
- DIP - Introduction to Probability
- DIP - Histogram Equalization
- DIP - Gray Level Transformations
- DIP - Concept of convolution
- DIP - Concept of Masks
- DIP - Concept of Blurring
- DIP - Concept of Edge Detection
- DIP - Prewitt Operator
- DIP - Sobel operator
- DIP - Robinson Compass Mask
- DIP - Krisch Compass Mask
- DIP - Laplacian Operator
- DIP - Frequency Domain Analysis
- DIP - Fourier series and Transform
- DIP - Convolution theorm
- DIP - High Pass vs Low Pass Filters
- DIP - Introduction to Color Spaces
- DIP - JPEG compression
- DIP - Optical Character Recognition
- DIP - Computer Vision and Graphics
Histogram Sliding
The basic concept of histograms has been discussed in the tutorial of Introduction to histograms. But we will briefly introduce the histogram here.
Histogram
Histogram is nothing but a graph that shows frequency of occurrence of data. Histograms has many use in image processing, out of which we are going to discuss one user here which is called histogram sliding.
Histogram sliding
In histogram sliding, we just simply shift a complete histogram rightwards or leftwards. Due to shifting or sliding of histogram towards right or left, a clear change can be seen in the image.In this tutorial we are going to use histogram sliding for manipulating brightness.
The term i-e: Brightness has been discussed in our tutorial of introduction to brightness and contrast. But we are going to briefly define here.
Brightness
Brightness is a relative term. Brightness can be defined as intensity of light emit by a particular light source.
Contrast
Contrast can be defined as the difference between maximum and minimum pixel intensity in an image.
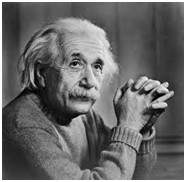
Sliding Histograms
Increasing brightness using histogram sliding
Histogram of this image has been shown below.
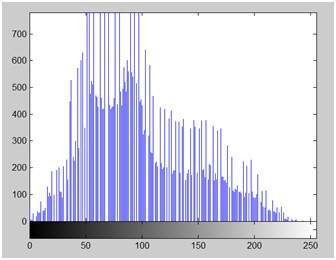
On the y axis of this histogram are the frequency or count. And on the x axis, we have gray level values. As you can see from the above histogram, that those gray level intensities whose count is more then 700, lies in the first half portion, means towards blacker portion. Thats why we got an image that is a bit darker.
In order to bright it, we will slide its histogram towards right, or towards whiter portion. In order to do we need to add atleast a value of 50 to this image. Because we can see from the histogram above, that this image also has 0 pixel intensities, that are pure black. So if we add 0 to 50, we will shift all the values lies at 0 intensity to 50 intensity and all the rest of the values will be shifted accordingly.
Lets do it.
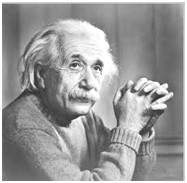
Here what we got after adding 50 to each pixel intensity.
The image has been shown below.
And its histogram has been shown below.
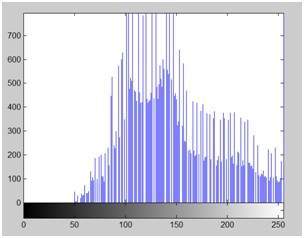
Lets compare these two images and their histograms to see that what change have to got.
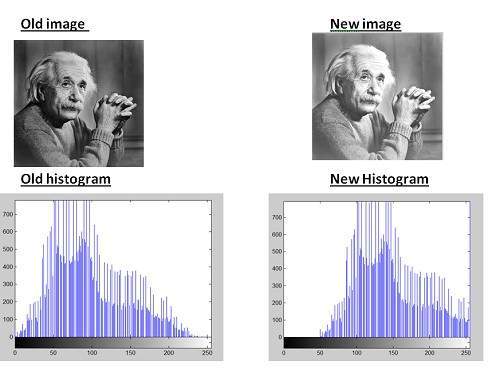
Conclusion
As we can clearly see from the new histogram that all the pixels values has been shifted towards right and its effect can be seen in the new image.
Decreasing brightness using histogram sliding
Now if we were to decrease brightness of this new image to such an extent that the old image look brighter, we got to subtract some value from all the matrix of the new image. The value which we are going to subtract is 80. Because we already add 50 to the original image and we got a new brighter image, now if we want to make it darker, we have to subtract at least more than 50 from it.
And this what we got after subtracting 80 from the new image.
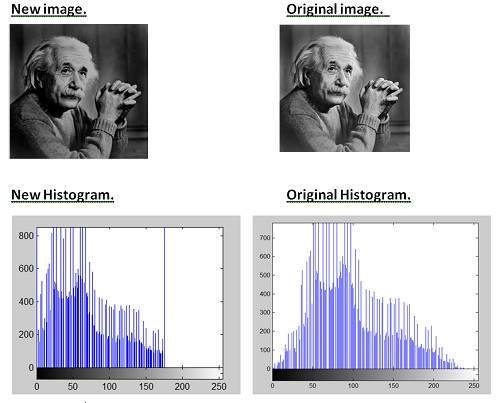
Conclusion
It is clear from the histogram of the new image, that all the pixel values has been shifted towards right and thus, it can be validated from the image that new image is darker and now the original image look brighter as compare to this new image.