- Cypress - Home
- Cypress - Introduction
- Cypress - Architecture and Environment Setup
- Cypress - Test Runner
- Cypress - Build First Test
- Cypress - Supported Browsers
- Cypress - Basic Commands
- Cypress - Variables
- Cypress - Aliases
- Cypress - Locators
- Cypress - Assertions
- Cypress - Text Verification
- Cypress - Asynchronous Behavior
- Cypress - Working with XHR
- Cypress - jQuery
- Cypress - Checkbox
- Cypress - Tabs
- Cypress - Dropdown
- Cypress - Alerts
- Cypress - Child Windows
- Cypress - Hidden Elements
- Cypress - Frames
- Cypress - Web Tables
- Cypress - Mouse Actions
- Cypress - Cookies
- Cypress - Get and Post
- Cypress - File Upload
- Cypress - Data Driven Testing
- Cypress - Prompt Pop-up Window
- Cypress - Dashboards
- Cypress - Screenshots and Videos
- Cypress - Debugging
- Cypress - Custom Commands
- Cypress - Fixtures
- Cypress - Environment Variables
- Cypress - Hooks
- Cypress - Configuration of JSON File
- Cypress - Reports
- Cypress - Plugins
- Cypress - GitHub
- Cypress Useful Resources
- Cypress - Quick Guide
- Cypress - Useful Resources
- Cypress - Discussion
Cypress - Debugging
Cypress has a very good debugging feature, where we can time travel and see what has actually happened during the test execution. This can be done by hovering the mouse over the Test Runner logs.
As we move through the steps in the Test Runner window, the elements get highlighted.We can also use the Cypress command pause. This pauses the execution, during which we can debug the previous steps. After that, we can again resume execution.
Implementation
The implementation of commands for debugging in Cypress is as follows −
describe('Tutorialspoint Test', function () {
   // test case
   it('Scenario 1', function (){
      // launch the application
      cy.visit("https://accounts.google.com");
      // enable cookie logging
      Cypress.Cookies.debug(true)
      cy.getCookies
      //pause execution
      cy.pause()
      cy.setCookie('cookie1', 'value1' )
   });
});
Execution Results
The output is as follows −
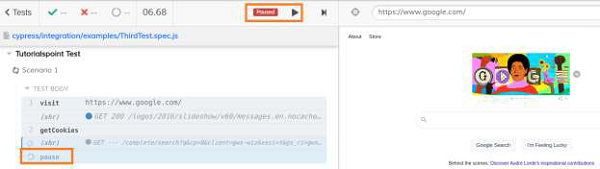
The output logs show that the execution has been paused (denoted by Paused button).Then again, we can resume it after debugging the previous steps by clicking the Resume button (appear beside Paused button).
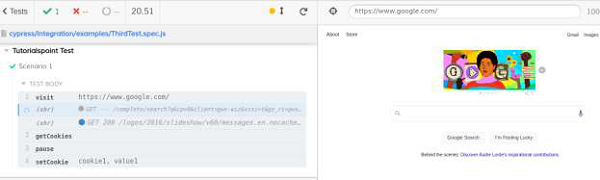
The output logs now have all the steps executed after resume from pause.
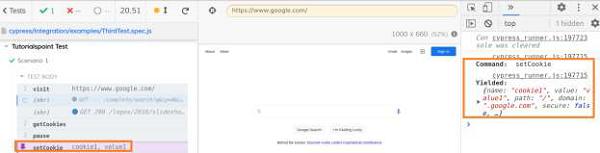
If we open the Developer Console (pressing F12) on the browser, and select a step from the Test Runner, the Console shall show the Command used and the valued Yielded.
For example, for the setCookie step, the Console shows Command − setCookie and Yielded shows the cookie name − cookie1 and value − value1.