- Cognos - Home
- Data Warehousing
- Data Warehouse - Overview
- Data Warehouse - Schemas
- ETL & Reporting Tools
- Cognos Basics
- Cognos - Introduction
- Cognos - Components and Services
- Cognos - Connections
- Cognos - Packages
- Cognos - Framework Manager
- Relationships in Metadata Model
- Query Studio
- Cognos - Query Studio
- Cognos - Ad-hoc Reports
- Cognos - Report Types
- Cognos - Creating a Report
- Cognos - Open an Existing Report
- Cognos - Add Data to a Report
- Cognos - Saving a Report
- Cognos - Run a Report
- Cognos - Printing a Report
- Report Studio
- Cognos - Report Studio
- Cognos - Report Templates
- Cognos - List Report
- Cognos - Crosstab Report
- Cognos - Creating a Chart
- Cognos - Report Functions
- Cognos - Report Validation
- Cognos - Report Run with Options
- Cognos - Report Administration
- Cognos - Filters
- Cognos - Custom Calculations
- Analysis Studio
- Cognos - Analysis Studio
- Cognos - Create an Analysis
- Cognos - Save an Analysis
- Cognos - Open Existing Analysis
- Event Studio
- Cognos - Event Studio
- Cognos - Notification Methods
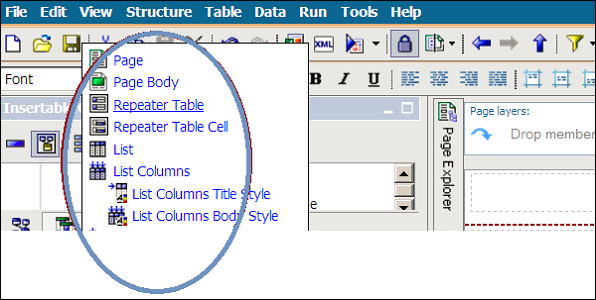
Cognos - Report Templates
In Report Studio, you can create different types of reports. They allow you to present the data in different formats like a list report can be used to show the customer information.
The following reports can be created in Report Studio −
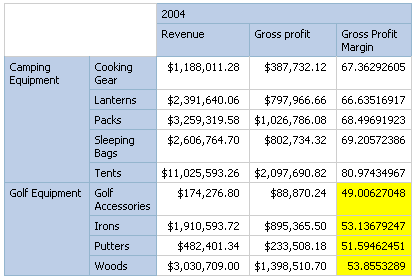
List Report
This report is used to show the data in detailed format. Data is shown in rows and columns and each column contains all the values of a data item.
| Quarter | Order number | Quantity | Revenue |
|---|---|---|---|
| Q4 | 101035 | 105 | $4,200.00 |
| 101037 | 90 | $8,470.80 | |
| 101044 | 124 | $11,479.92 | |
| 101052 | 193 | $15,952.42 | |
| 101064 | 58 | $5,458.96 | |
| 101065 | 78 | $7,341.36 | |
| 101081 | 145 | $5,800.00 | |
| 101092 | 81 | $7,623.72 | |
| 101093 | 50 | $4,706.00 | |
| 101103 | 139 | $5,560.00 |
Crosstab
Like list report, a cross tab report also shows the data in row and columns, but the data is compact and not detailed. At the intersection points of rows and columns, you show the summarized data.
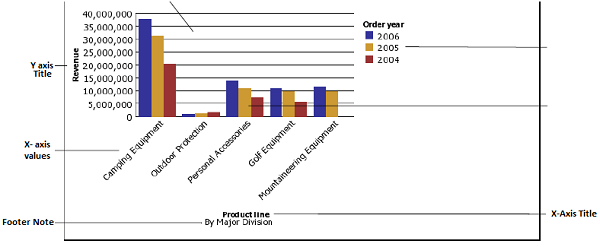
Chart
You can use the Report Studio to create many chart types, including column, bar, area, and line charts. You can also create custom charts that combine these chart types.
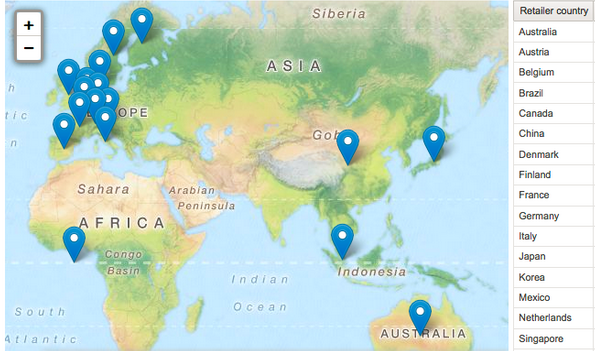
Map
You can also use maps in the Report Studio to present data for a particular region, country or a location.
A map report consists of three parts −
- Region Layer
- Point Layer
- Display Layer
Repeater
Repeaters are used to add repeat items in a report while running the report. To add a Repeater, drag a repeater from the tool box to work area.