- Cognos - Home
- Data Warehousing
- Data Warehouse - Overview
- Data Warehouse - Schemas
- ETL & Reporting Tools
- Cognos Basics
- Cognos - Introduction
- Cognos - Components and Services
- Cognos - Connections
- Cognos - Packages
- Cognos - Framework Manager
- Relationships in Metadata Model
- Query Studio
- Cognos - Query Studio
- Cognos - Ad-hoc Reports
- Cognos - Report Types
- Cognos - Creating a Report
- Cognos - Open an Existing Report
- Cognos - Add Data to a Report
- Cognos - Saving a Report
- Cognos - Run a Report
- Cognos - Printing a Report
- Report Studio
- Cognos - Report Studio
- Cognos - Report Templates
- Cognos - List Report
- Cognos - Crosstab Report
- Cognos - Creating a Chart
- Cognos - Report Functions
- Cognos - Report Validation
- Cognos - Report Run with Options
- Cognos - Report Administration
- Cognos - Filters
- Cognos - Custom Calculations
- Analysis Studio
- Cognos - Analysis Studio
- Cognos - Create an Analysis
- Cognos - Save an Analysis
- Cognos - Open Existing Analysis
- Event Studio
- Cognos - Event Studio
- Cognos - Notification Methods
Selected Reading
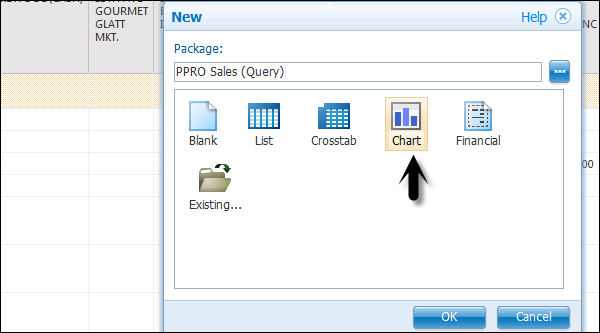
Cognos - Creating a Chart
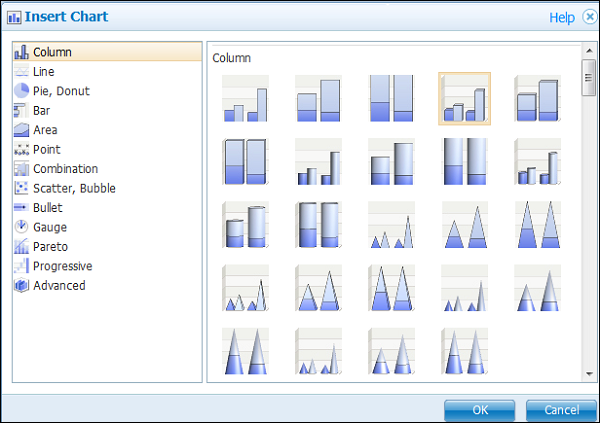
In Report Studio, you can create many chart types like column, bar, area, line charts or a custom chart that combines these chart types.
In the Source tab, expand the query.
- Drag Revenue to the Measure (y-axis) drop zone.
- Drag Current year to the Series drop zone.
- Drag Order to the Categories (x-axis) drop zone.
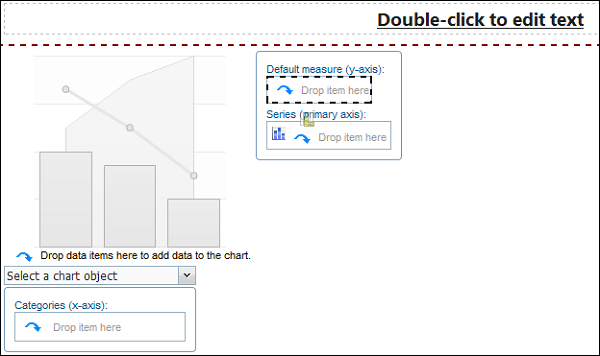
Drag the objects as shown in the above screenshot.
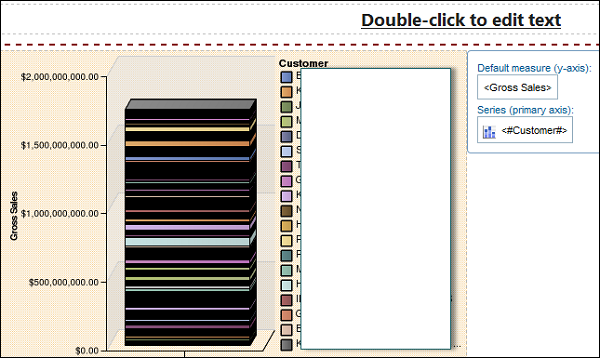
Save the chart using the tool bar at the top. Save it to Public or My Folder as mentioned in the previous topic. Run the report to see the result in a chart format.
You can also create a Repeater table or a map report in Cognos Report Studio.

Advertisements