 Data Structure
 Networking
 RDBMS
RDBMS Operating System
 Java
Java MS Excel
 iOS
iOS HTML
HTML CSS
CSS Android
 Python
 C Programming
 C++
C++ C#
C# MongoDB
 MySQL
MySQL Javascript
 PHP
PHP
- Selected Reading
- UPSC IAS Exams Notes
- Developer's Best Practices
- Questions and Answers
- Effective Resume Writing
- HR Interview Questions
- Computer Glossary
- Who is Who
Clustering, Connectivity and other Graph properties using Python Networkx
Python NetworkX is a popular open-source Python library used for the creation, manipulation, and analysis of complex networks or graphs. It provides a wide range of tools, algorithms, and functions to work with graphs, making it a valuable resource for network analysis and research.
Python NetworkX allows us to represent and work with different types of graphs, such as directed graphs, undirected graphs, multigraphs (graphs with multiple edges between nodes), and weighted graphs (graphs with edge weights). It also provides a simple and intuitive interface for creating, adding nodes and edges, and performing various operations on graphs.
Installation and importing of NetworkX
To use NetworkX, we have to install it using the Python package manager pip by running the following command in the command prompt.
pip install networkx
Once NetworkX installed in our python environment, we can import the library in our Python script or interactive environment and start using its functionalities by executing the below command.
import networkx as nx
NetworkX library offers a wide range of properties such as clustering, connectivity, and other graph properties, let's see about them in detail in this article.
Clustering Coefficient
The clustering coefficient is a measure of the degree to which nodes in a graph tend to cluster together. It quantifies the presence of triangles in the graph, where a triangle consists of three nodes that are all connected to each other. A high clustering coefficient indicates that nodes in the graph are more likely to form tightly connected clusters.
In NetworkX, we can calculate the clustering coefficient using the average_clustering() function to obtain the average clustering coefficient of a graph, or the clustering() function to compute the clustering coefficient of individual nodes.
Average Clustering Coefficient
The average_clustering() function in NetworkX calculates the average clustering coefficient of a graph. It returns a single value that represents the average clustering coefficient across all nodes in the graph. The formula to calculate the average clustering coefficient is based on the local clustering coefficient of each node and the number of nodes.
Example
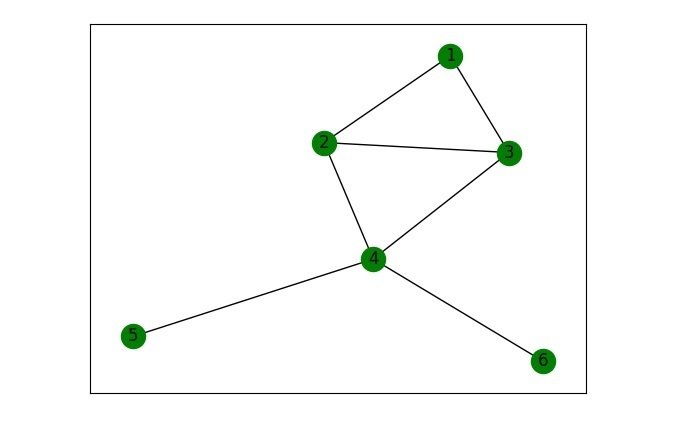
In this example, we are creating a simple undirected graph using the nx.Graph() function and add edges using the add_edges_from() function. Then, we calculate the average clustering coefficient using nx.average_clustering() and print the result along with the plotting the graph using the nx.draw_network() function.
import networkx as nx
import matplotlib.pyplot as plt

G = nx.Graph()
G.add_edges_from([(1, 2), (1, 3), (2, 3), (2, 4), (3, 4), (4, 5), (4, 6)])
avg_clustering = nx.average_clustering(G)
nx.draw_networkx(G, with_labels = True, node_color ='green')
print("Average Clustering Coefficient:", avg_clustering)
Output
Average Clustering Coefficient: 0.4166666666666666
Node Clustering Coefficient
The clustering() function in NetworkX calculates the clustering coefficient of individual nodes in a graph. It returns a dictionary where the keys are the nodes in the graph, and the values are their corresponding clustering coefficients.
The clustering coefficient of a node is computed as the ratio of the number of connections between the neighbors of the node to the total number of possible connections.
Example
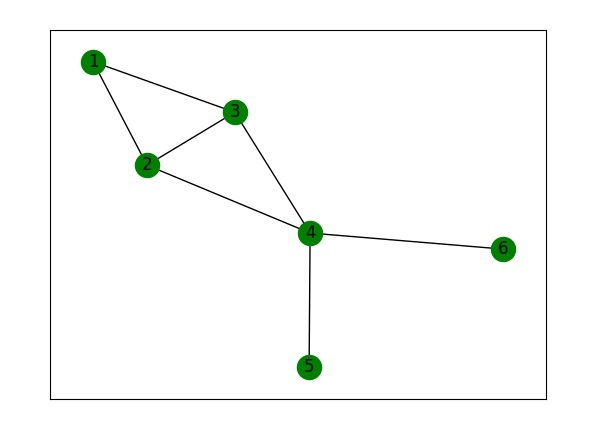
In this example, we create a graph and add edges. Then, we calculate the clustering coefficient of each node using nx.clustering() and print the results using a loop.
import networkx as nx
import matplotlib.pyplot as plt

# Create a graph
G = nx.Graph()
G.add_edges_from([(1, 2), (1, 3), (2, 3), (2, 4), (3, 4), (4, 5), (4, 6)])
# Calculate the clustering coefficient of each node
node_clustering = nx.clustering(G)
print("Node Clustering Coefficients:")
for node, clustering_coefficient in node_clustering.items():
   print(f"Node {node}: {clustering_coefficient}")
nx.draw_networkx(G, with_labels = True, node_color ='green')
Output
Node Clustering Coefficients:
Node 1: 1.0
Node 2: 0.6666666666666666
Node 3: 0.6666666666666666
Node 4: 0.16666666666666666
Node 5: 0
Node 6: 0
Connectivity
Connectivity refers to the property of a graph that determines whether all nodes are reachable from any other node. NetworkX offers functions to determine the connectivity of a graph, such as is_connected() and is_strongly_connected().
Example
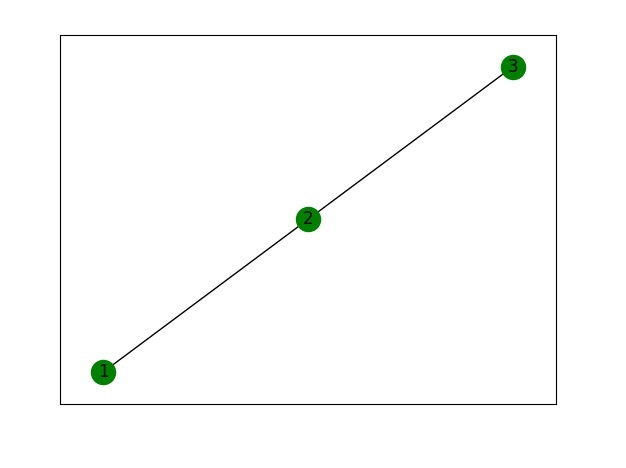
In this example, we create a graph and add edges. Then, we use nx.is_connected() to check if the graph is connected. The function returns True if all nodes are reachable from any other node otherwise, it returns False.
import networkx as nx
import matplotlib.pyplot as plt

# Create a graph
G = nx.Graph()
G.add_edges_from([(1, 2), (2, 3)])
# Check if the graph is connected
connected = nx.is_connected(G)
print("Is Graph Connected?", connected)
nx.draw_networkx(G, with_labels = True, node_color ='green')
Output
Is Graph Connected? True
Degree Centrality
Degree centrality is a measure that quantifies the importance or centrality of a node based on its degree i.e. number of connections. NetworkX provides the degree_centrality() function to calculate the degree centrality of nodes in a graph.
Example
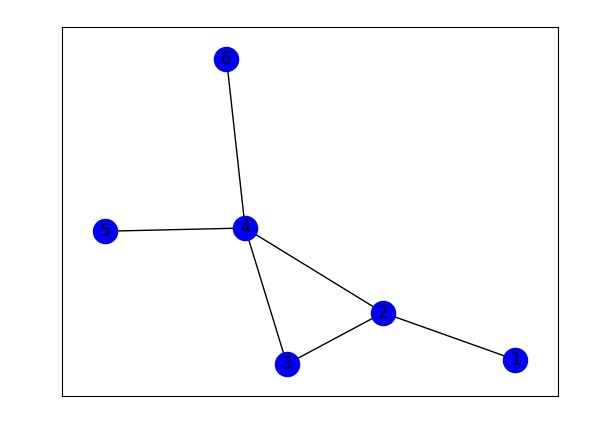
In this example, we are creating a graph and add edges. Then, we calculate the degree centrality using nx.degree_centrality() and print the result, which gives a dictionary of nodes and their corresponding degree centrality values.
import networkx as nx
import matplotlib.pyplot as plt

# Create a graph
G = nx.Graph()
G.add_edges_from([(1, 2), (2, 3), (2, 4), (3, 4), (4, 5), (4, 6)])
# Calculate degree centrality
centrality = nx.degree_centrality(G)
print("Degree Centrality:", centrality)
nx.draw_networkx(G, with_labels = True, node_color ='blue')
Output
Degree Centrality: {1: 0.2, 2: 0.6000000000000001, 3: 0.4, 4: 0.8, 5: 0.2, 6: 0.2}


