- Bugzilla - Home
- Bugzilla - Overview
- Installation Prerequisites
- Bugzilla - Installation
- Bugzilla - Sample Web Application
- New Account Creation
- Bugzilla - Login
- Bugzilla - Logging a New Bug
- Bugzilla - Clone a Bug
- Bugzilla - Understanding a Bug
- Bugzilla - Editing a Bug
- Bugzilla - Reports
- Bugzilla - Graphical Reports
- Bugzilla - Tabular Reports
- Bugzilla - Duplicate
- Bugzilla - Browse Function
- Bugzilla - Simple Search
- Bugzilla - Quick Search
- Bugzilla - Advance Search
- Bugzilla - Custom Search
- Bugzilla - Bug Lists
- Bugzilla - Preferences
- Bugzilla - General Preferences
- Bugzilla - Email Preferences
- Bugzilla - Saved Searches
- Bugzilla - Account Information
- Bugzilla - Permissions
Bugzilla - Tabular Reports
The Tabular Reports represent tables of bug counts in 1, 2 or 3 dimensions as HTML or CSV. To generate Tabular reports in Bugzilla, we have to follow the steps given below.
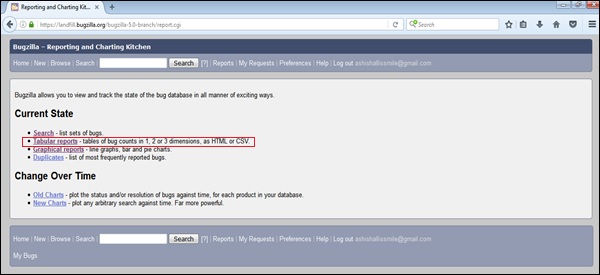
Step 1 − Click on the Reports hyperlink in the Header section of the homepage and then click on the Tabular Reports in the Current State section as shown in the following screenshot.
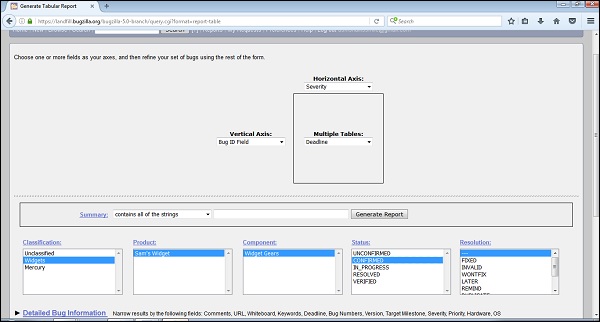
Step 2 − Similar to Graphical Reports, select Vertical, Horizontal axis along with Multiple tables (if required) and provide details in the other fields.
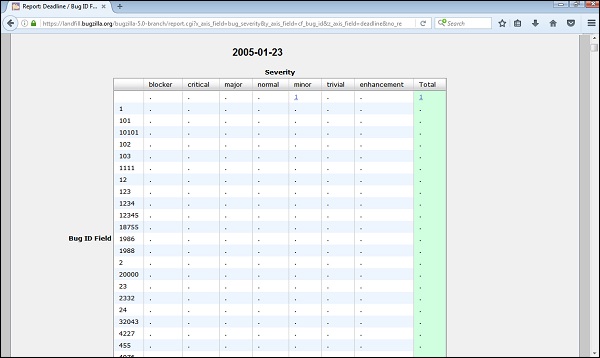
Step 3 − After selecting all the fields, click on Generate Report. Based on the deadlines, it generates multiple tables −
Step 4 − By clicking on CSV hyperlink below the table, it converts the report into a CSV file.
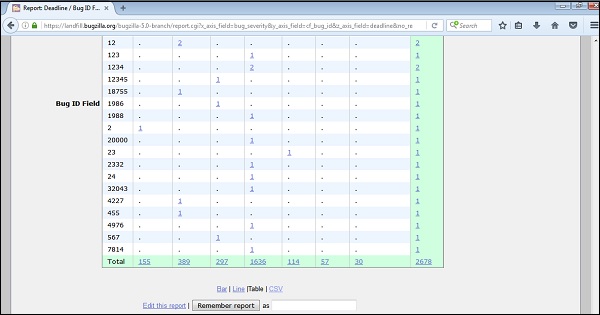

Click OK after the appropriate selection, it will open an Excel sheet with the details of all the data tables.
