- Bugzilla - Home
- Bugzilla - Overview
- Installation Prerequisites
- Bugzilla - Installation
- Bugzilla - Sample Web Application
- New Account Creation
- Bugzilla - Login
- Bugzilla - Logging a New Bug
- Bugzilla - Clone a Bug
- Bugzilla - Understanding a Bug
- Bugzilla - Editing a Bug
- Bugzilla - Reports
- Bugzilla - Graphical Reports
- Bugzilla - Tabular Reports
- Bugzilla - Duplicate
- Bugzilla - Browse Function
- Bugzilla - Simple Search
- Bugzilla - Quick Search
- Bugzilla - Advance Search
- Bugzilla - Custom Search
- Bugzilla - Bug Lists
- Bugzilla - Preferences
- Bugzilla - General Preferences
- Bugzilla - Email Preferences
- Bugzilla - Saved Searches
- Bugzilla - Account Information
- Bugzilla - Permissions
Bugzilla - Graphical Reports
Graphical reports are a group of line, bar and pie charts. These Reports are helpful in many ways, for example if a user wants to know which component has the maximum number of defects reported and wants to represent in the graph, then that user can select from the following two options −
- Severity on the X-axis
- Component on the Y-axis
Then click on Generate Report.
It will generate a report with crucial information. Similarly, the user can a select number of combinations from those that are available.
Generate Graphical Reports
To generate graphical reports in Bugzilla, we have to follow the steps given below.
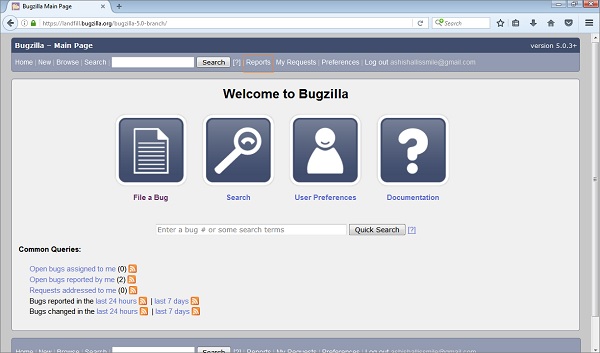
Step 1 − To begin with, click on the Reports link at the header of the homepage.
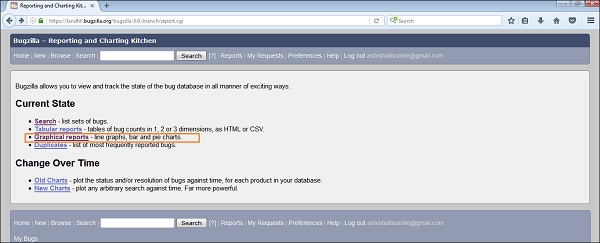
Step 2 − Click on the Graphical Reports hyperlink, which is listed under the Current State section as shown in the following screenshot.
Step 3 − Now, set various options to present reports graphically. Some of the important options are given below.
- Vertical Axis
- Horizontal Axis
- Multiple Images
- Format- Line graph, Bar chart or Pie chart
- Plot data set
- Classify your bug
- Classify your product
- Classify your component
- Classify bug status
- Select resolution
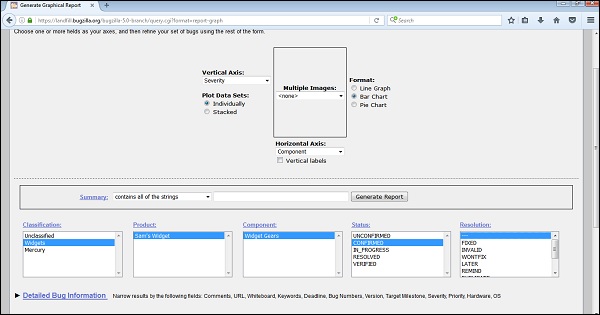
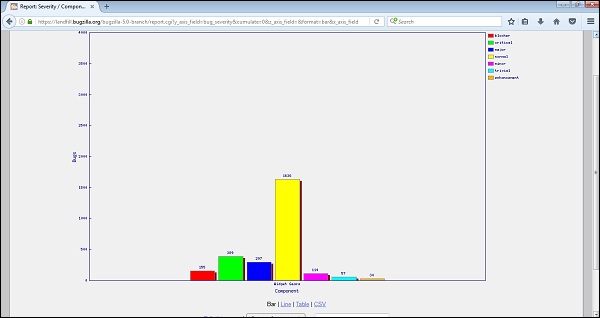
Step 4 − Click on Generate Report to display a Bar chart, where the Severity of a bug is the vertical axis, while the Component Widget Gears is the horizontal axis.
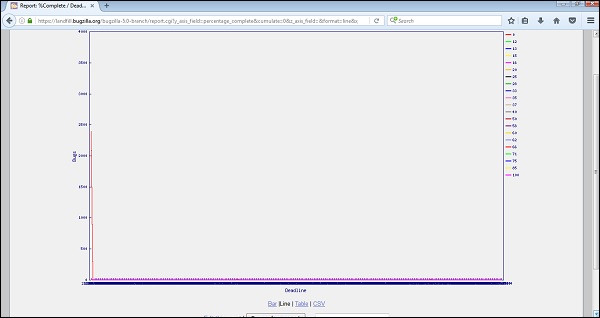
Step 5 − Similarly, a Line Graph can be created for % Complete Vs Deadline.
The result for the above mentioned line graph will be as follows.