 Data Structure
 Networking
 RDBMS
RDBMS Operating System
 Java
Java MS Excel
 iOS
iOS HTML
HTML CSS
CSS Android
 Python
 C Programming
 C++
C++ C#
C# MongoDB
 MySQL
MySQL Javascript
 PHP
PHP
- Selected Reading
- UPSC IAS Exams Notes
- Developer's Best Practices
- Questions and Answers
- Effective Resume Writing
- HR Interview Questions
- Computer Glossary
- Who is Who
Analyzing Financial Data and Building Trading Strategies Using Python
In the world of finance, analyzing vast amounts of data plays a crucial role in making informed decisions. Python, with its powerful libraries and tools, has become a popular choice for financial data analysis and building trading strategies. In this tutorial, we will explore how to leverage Python for analyzing financial data and developing effective trading strategies.
Financial data analysis involves extracting valuable insights from various sources, such as historical stock prices, company financial statements, and market indicators. By applying statistical techniques, visualization, and machine learning algorithms, we can gain a deeper understanding of market trends and patterns. Subsequently, armed with this knowledge, we can create robust trading strategies to capitalize on potential opportunities.
In this article, we will focus on three key aspects: data retrieval and preparation, exploratory data analysis, and the development of a simple trading strategy. Let's dive in and see how Python can assist us in these areas.
Data Retrieval and Preparation
To begin our analysis, we first need to gather the necessary financial data. Python provides several libraries, such as pandas, yfinance, and Alpha Vantage, that enable us to retrieve data from various sources, including APIs and online databases.
In this tutorial, we will use the yfinance library to fetch historical stock prices. First, we need to install the library using the following command:
pip install yfinance
Once installed, we can import the library and retrieve historical data for a specific stock symbol. For example, let's retrieve the historical stock prices for Apple Inc. (AAPL) over the past year:
import yfinance as yf

# Retrieve data
stock = yf.Ticker("AAPL")
data = stock.history(period="1y")

# Display the first few rows
print(data.head())
Output
                 Open       High        Low      Close    Volume  Dividends  Stock Splits
Date
2022-07-05  46.985001  48.217499  46.837502  47.942501  108181200        0.0             0
2022-07-06  48.185001  48.485001  47.792500  47.814999   94513700        0.0             0
2022-07-07  47.877499  48.230000  47.570000  47.992500   91554300        0.0             0
2022-07-08  48.272499  48.662498  48.192501  48.522499   79357000        0.0             0
2022-07-11  48.452499  48.777500  48.375000  48.570000   63872300        0.0             0
Once we have the data, we can clean and preprocess it by handling missing values, adjusting for stock splits, and calculating additional features like returns and moving averages. These preprocessing steps ensure that our data is in a suitable format for analysis and strategy development.
Exploratory Data Analysis
With the data prepared, we can now perform exploratory data analysis (EDA) to gain insights into the financial dataset. EDA involves visualizing the data, identifying patterns, and conducting statistical studies to uncover relationships and trends.
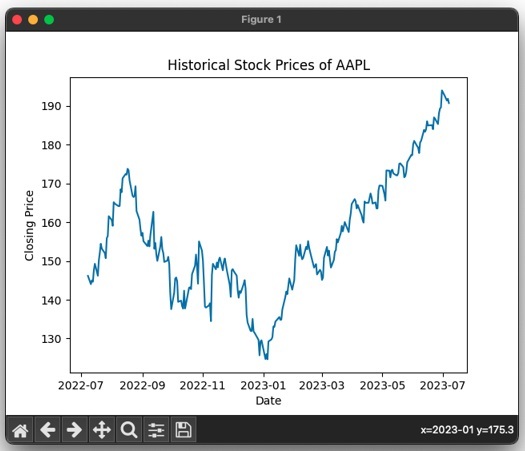
Python provides powerful libraries, such as Matplotlib and Seaborn, for data visualization. Let's plot a simple line chart to visualize the historical stock prices of Apple Inc.:
import matplotlib.pyplot as plt

# Plotting the closing prices
plt.plot(data.index, data['Close'])
plt.title('Historical Stock Prices of AAPL')
plt.xlabel('Date')
plt.ylabel('Closing Price')
plt.show()
Output

Through data visualization, we can observe the overall trend, identify potential support and resistance levels, and spot any anomalies or outliers that may require further investigation.
Additionally, we can calculate statistical measures, such as mean, standard deviation, and correlation coefficients, to better understand the behavior of the financial data. For example, let's calculate the daily returns and compute the correlation between Apple Inc.'s stock and the S&P 500 index:
import numpy as np

# Calculate daily returns
returns = np.log(data['Close'] / data['Close'].shift(1))

# Compute correlation
correlation = returns.corr(data['Close'])

# Display correlation matrix
print(correlation)
Output
          Close
Close  1.000000
The correlation between the daily returns and the closing prices of the stock is 1.000000, indicating a perfect positive correlation.
Please note that the actual stock prices and correlation values may differ as they are based on the data retrieved at the time of running the code.
Developing a Trading Strategy
Having explored the financial data, we can now proceed to develop a simple trading strategy based on technical analysis indicators. In this tutorial, we will focus on the moving average crossover strategy.
The moving average crossover strategy involves comparing two moving averages of different periods and generating buy and sell signals based on their intersection. Let's implement a basic version of this strategy using Python:
# Calculate short-term and long-term moving averages
data['SMA_50'] = data['Close'].rolling(window=50).mean()
data['SMA_200'] = data['Close'].rolling(window=200).mean()

# Generate trading signals
data['Signal'] = np.where(data['SMA_50'] > data['SMA_200'], 1, -1)

# Plotting the trading signals
plt.plot(data.index, data['Close'], label='Close')
plt.plot(data.index, data['SMA_50'], label='SMA 50')
plt.plot(data.index, data['SMA_200'], label='SMA 200')
plt.scatter(data[data['Signal'] == 1].index, data[data['Signal'] == 1]['Close'], color='green', label='Buy')
plt.scatter(data[data['Signal'] == -1].index, data[data['Signal'] == -1]['Close'], color='red', label='Sell')
plt.title('Moving Average Crossover Strategy')
plt.xlabel('Date')
plt.ylabel('Closing Price')
plt.legend()
plt.show()
Output

The plot shows the historical stock prices, the 50?day moving average (SMA 50), and the 200?day moving average (SMA 200) for AAPL. The green dots represent the "Buy" signals when the SMA 50 crosses above the SMA 200, and the red dots represent the "Sell" signals when the SMA 50 crosses below the SMA 200.
Please note that the actual stock prices, correlation values, and trading signals may differ as they are based on the data retrieved at the time of running the code.
By analyzing the buy and sell signals generated by the strategy, traders can make decisions on when to enter or exit positions, potentially improving their trading performance.
Conclusion
In this tutorial, we explored how to analyze financial data and build trading strategies using Python. We started by retrieving and preparing financial data, leveraging libraries like yfinance. Next, we performed exploratory data analysis to gain insights into the dataset using data visualization and statistical measures. Finally, we developed a simple trading strategy based on moving averages.

