 Data Structure
 Networking
 RDBMS
RDBMS Operating System
 Java
Java MS Excel
 iOS
iOS HTML
HTML CSS
CSS Android
 Python
 C Programming
 C++
C++ C#
C# MongoDB
 MySQL
MySQL Javascript
 PHP
PHP
- Selected Reading
- UPSC IAS Exams Notes
- Developer's Best Practices
- Questions and Answers
- Effective Resume Writing
- HR Interview Questions
- Computer Glossary
- Who is Who
Analyzing selling price of used cars using Python
Analyzing the selling price of used cars is crucial for both buyers and sellers to make informed decisions which can easily be done using Python. By leveraging Python's data analysis and visualization capabilities, valuable insights can be gained from the available dataset.
This article explores the process of data preprocessing, cleaning, and analyzing the selling price using various plots. Additionally, it covers predicting the selling price using a Linear Regression model. With Python's powerful libraries such as pandas, matplotlib, seaborn, and scikit-learn, this analysis provides a comprehensive approach to understanding the factors influencing used car prices and making accurate price predictions.
How to analyze the selling price of used cars using Python?
Follow the steps given below to analyze the selling price of used cars using Python ?
Step 1: Import the important libraries
import pandas as pd
import matplotlib.pyplot as plt
import seaborn as sns
from sklearn.model_selection import train_test_split
from sklearn.linear_model import LinearRegression
from sklearn.metrics import mean_squared_error
Step 2:Read the dataset and store it in pandas dataframe
data = pd.read_csv('C:/Users/Tutorialspoint/Documents/autos.csv', encoding='latin1')
Step 3: Check the structure of the dataset
data.info()
print(data.head())
Output
dateCrawled  seller offerType  price vehicleType  \
3 2016-03-17 16:54:04  privat   Angebot   1500  kleinwagen
4 2016-03-31 17:25:20  privat   Angebot   3600  kleinwagen
5 2016-04-04 17:36:23  privat   Angebot    650   limousine
6 2016-04-01 20:48:51  privat   Angebot   2200      cabrio
7 2016-03-21 18:54:38  privat   Angebot      0   limousine

   yearOfRegistration  gearbox  powerPS    model  kilometer  \
3                2001  manuell       75     golf     150000
4                2008  manuell       69    fabia      90000
5                1995  manuell      102      3er     150000
6                2004  manuell      109  2_reihe     150000
7                1980  manuell       50   andere      40000

   monthOfRegistration fuelType       brand notRepairedDamage dateCreated  \
3                    6   benzin  volkswagen              nein  2016-03-17
4                    7   diesel       skoda              nein  2016-03-31
5                   10   benzin         bmw                ja  2016-04-04
6                    8   benzin     peugeot              nein  2016-04-01
7                    7   benzin  volkswagen              nein  2016-03-21

              lastSeen
3  2016-03-17 17:40:17
4  2016-04-06 10:17:21
5  2016-04-06 19:17:07
6  2016-04-05 18:18:39
7  2016-03-25 16:47:58
Step 4: Handling missing values
data = data.dropna()
Step 5: Convert the datatypes only if necessary
data['dateCrawled'] = pd.to_datetime(data['dateCrawled'])
data['dateCreated'] = pd.to_datetime(data['dateCreated'])
Step 6: Data Cleaning
# Remove irrelevant columns
columns_to_drop = ['name', 'abtest', 'nrOfPictures', 'postalCode']
data = data.drop(columns=columns_to_drop)
Step 7: Analyzing Selling Price Using Plots
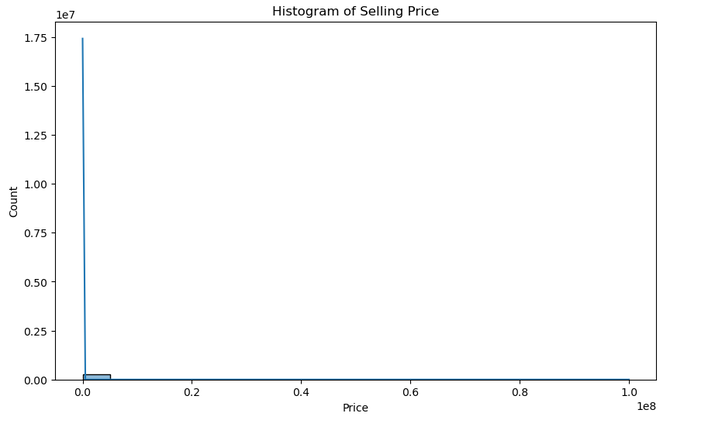
Example 1: Histogram of Selling Price
plt.figure(figsize=(10, 6))
sns.histplot(data['price'], bins=20, kde=True)
plt.xlabel('Price')
plt.ylabel('Count')
plt.title('Histogram of Selling Price')
plt.show()
Output

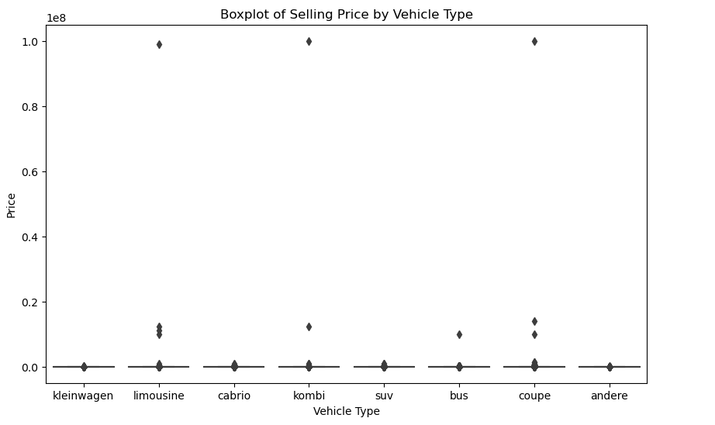
Example 2: Boxplot of Selling Price by Vehicle Type
plt.figure(figsize=(10, 6))
sns.boxplot(x='vehicleType', y='price', data=data)
plt.xlabel('Vehicle Type')
plt.ylabel('Price')
plt.title('Boxplot of Selling Price by Vehicle Type')
plt.show()
Output

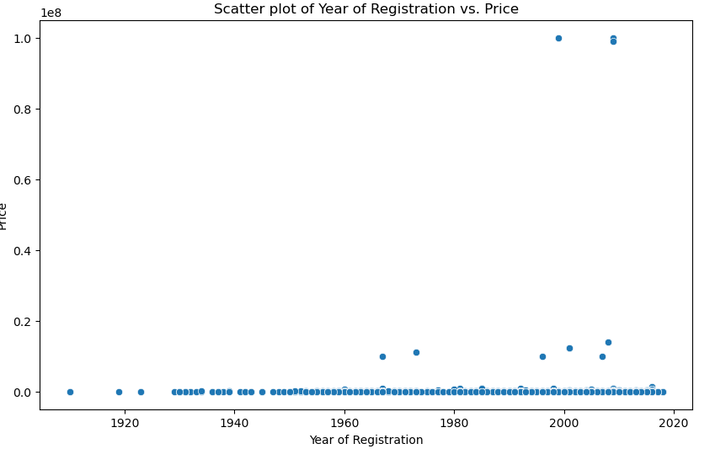
Example 3: Scatter plot of Year of Registration vs. Price
plt.figure(figsize=(10, 6))
sns.scatterplot(x='yearOfRegistration', y='price', data=data)
plt.xlabel('Year of Registration')
plt.ylabel('Price')
plt.title('Scatter plot of Year of Registration vs. Price')
plt.show()
Output

Step 8: Predicting Selling Price using Linear Regression
Select relevant features and target variable
features = ['yearOfRegistration', 'powerPS', 'kilometer']
target = 'price'
X = data[features]
y = data[target]
Split the data into training and testing sets:
X_train, X_test, y_train, y_test = train_test_split(X, y, test_size=0.2, random_state=42)
Initialize and train the Linear Regression model
model = LinearRegression()
model.fit(X_train, y_train)
Output
LinearRegression
Step 9: Make predictions on the test set and print the predicted selling price
# Make predictions on the test set
y_pred = model.predict(X_test)

# Print the predicted selling price
print("Predicted Selling Price:")
for price in y_pred:
   print(price)
Output
Predicted Selling Price:
4697.820983235375
4882.88628493459
2407.3556394173065
4264.297985512414
5801.285403149028
6486.864555639331
18844.05037380848
3615.3753698624205
15154.480417441286
7511.02954521589
5815.107292202709
14360.747495675983
3868.0368050450925
6433.695591624826
3019.621718226932
??????????????
3723.5291391374194
Step 10: Evaluate the model using Mean Squared Error (MSE)
mse = mean_squared_error(y_test, y_pred)
print(f"Mean Squared Error: {mse}")
Output
Mean Squared Error: 3838157266.6337757
Conclusion
In conclusion, Python's versatility and powerful libraries make it an ideal tool for analyzing the selling price of used cars. Through data preprocessing, cleaning, and visualization, valuable insights can be obtained. Furthermore, predictive modeling with machine learning algorithms enables accurate price predictions. This analysis empowers both buyers and sellers to make informed decisions in the used car market.

