
Article Categories
- All Categories
-
 Data Structure
-
 Networking
-
 RDBMS
RDBMS
-
 Operating System
-
 Java
Java
-
 MS Excel
-
 iOS
iOS
-
 HTML
HTML
-
 CSS
CSS
-
 Android
-
 Python
-
 C Programming
-
 C++
C++
-
 C#
C#
-
 MongoDB
-
 MySQL
MySQL
-
 Javascript
-
 PHP
PHP
-
 Economics & Finance
Get Financial Data from Yahoo Finance with Python
Trading, investing, and other financial professionals need access to financial data since investment research is reliant on it. Yahoo Finance, which offers up-to-date market statistics, news, and analysis, is one of the most well-known sources of financial information. Python is a robust and flexible programming language that can be used to extract financial data from Yahoo Finance, so in this post, we'll be utilizing the yfinance package to do just that.
Installation and Syntax
Before we get started, we need to install the yfinance library, which allows us to access Yahoo Finance data from Python. We can install yfinance using pip, the Python package installer.
pip install yfinance
Once we have yfinance installed, we can start using it in our Python scripts. The syntax for importing yfinance is straightforward ?
import yfinance as yf
Algorithm
To retrieve financial data from Yahoo Finance, we first need to create an instance of the yfinance Ticker class, which represents a specific stock or other financial instrument.
We can create a Ticker instance by passing a stock symbol to the yf.Ticker() constructor, like this: msft = yf.Ticker("MSFT")
-
Once we have a Ticker instance, we can use its methods to retrieve financial data. For example, we can use the history() method to retrieve historical price data for the stock:
hist = msft.history(period="max")
The period parameter specifies the time period for which we want to retrieve data. In this case, we're retrieving data for the entire history of the stock.
We can also use other methods of the Ticker class to retrieve other types of financial data, such as dividends, splits, and financial statements.
Common Functions
yf.Ticker(symbol) ? This method is used to create a Ticker object for a specific stock symbol. It returns an instance of the Ticker class that can be used to retrieve various financial data for the given stock symbol.
ticker.info ? This method returns a dictionary containing detailed information about the stock symbol, such as its name, industry, sector, exchange, and other financial metrics like market cap, dividend yield, P/E ratio, and more.
ticker.history() ? This method returns a pandas DataFrame containing the historical OHLC (open, high, low, close) prices, volume, and other financial data for the specified stock symbol over a specified time period.
ticker.recommendations() ? This method returns a pandas DataFrame containing the latest recommendations made by financial analysts for the given stock symbol, including the target price, recommendation rating, and the date of the recommendation.
ticker.calendar() ? This method returns a pandas DataFrame containing the upcoming earnings, dividend, and other important events for the given stock symbol.
ticker.sustainability() ? This method returns a pandas DataFrame containing the sustainability values for the given stock symbol, such as environmental, social, and governance (ESG) scores.
ticker.options ? This method returns a dictionary containing the expiration dates and other details of the options available for the given stock symbol.
Change the ticker symbol to get financial data for a specific stock.
Some popular ticker symbols are ?
Ticker Symbol |
Stock Name |
|---|---|
AAPL |
Apple Inc. |
MSFT |
Microsoft Corporation |
AMZN |
Amazon.com, Inc. |
TSLA |
Tesla, Inc. |
GOOGL |
Alphabet Inc. (Google) |
Example
import yfinance as yf
import pandas as pd
import matplotlib.pyplot as plt
# Create a Ticker object for a specific stock symbol
ticker = yf.Ticker("AAPL")
# Get detailed information about the stock symbol
info = ticker.info
print("Detailed Information:")
for key, value in info.items():
# format and indent the printed output
print(f"{key}: {value}")
print("-" * 10)
# Get historical OHLC prices and other financial data
history = ticker.history(period="1mo")
print("\nHistorical Data:")
print(history)
# Plot historical prices
plt.plot(history.index, history["Close"])
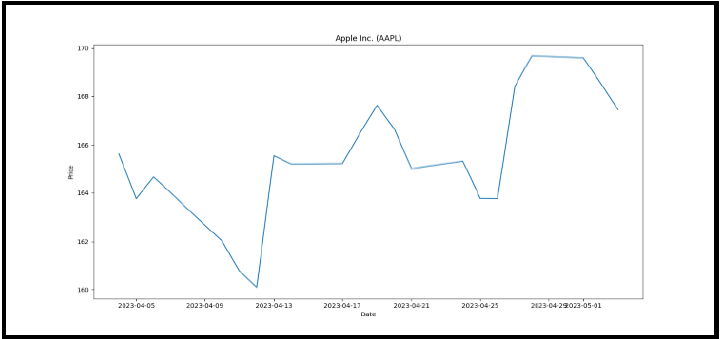
plt.title(f"{info['shortName']} ({info['symbol']})")
plt.xlabel("Date")
plt.ylabel("Price")
plt.show()
Output
Detailed Information:
address1: One Apple Park Way
----------
city: Cupertino
----------
state: CA
----------
zip: 95014
----------
country: United States
----------
phone: 408 996 1010
----------
website: https://www.apple.com
----------
industry: Consumer Electronics
----------
sector: Technology
----------
fullTimeEmployees: 164000
----------
maxAge: 86400
----------
priceHint: 2
----------
previousClose: 168.54
----------
open: 169.5
----------
dayLow: 167.16
----------
dayHigh: 170.92
----------
regularMarketPreviousClose: 168.54
----------
regularMarketOpen: 169.5
----------
regularMarketDayLow: 167.16
----------
regularMarketDayHigh: 170.92
----------
dividendRate: 0.92
----------
dividendYield: 0.0055
----------
exDividendDate: 1675987200
----------
payoutRatio: 0.1545
----------
fiveYearAvgDividendYield: 0.92
----------
totalRevenue: 387537010688
----------
debtToEquity: 195.868
----------
revenuePerShare: 24.084
----------
returnOnAssets: 0.19569999
----------
returnOnEquity: 1.47943
----------
grossProfits: 170782000000
----------
freeCashflow: 84729126912
----------
operatingCashflow: 109189996544
----------
earningsGrowth: -0.105
----------

Historical Data:

2023-04-21 00:00:00-04:00  165.050003  166.449997  164.490005  165.020004  58311900        0.0           0.0
2023-04-24 00:00:00-04:00  165.000000  165.600006  163.889999  165.330002  41949600        0.0           0.0
2023-04-25 00:00:00-04:00  165.190002  166.309998  163.729996  163.770004  48714100        0.0           0.0
2023-04-26 00:00:00-04:00  163.059998  165.279999  162.800003  163.759995  45498800        0.0           0.0
2023-04-27 00:00:00-04:00  165.190002  168.559998  165.190002  168.410004  64902300        0.0           0.0
2023-04-28 00:00:00-04:00  168.490005  169.850006  167.880005  169.679993  55209200        0.0           0.0
2023-05-01 00:00:00-04:00  169.279999  170.449997  168.639999  169.589996  52472900        0.0           0.0
2023-05-02 00:00:00-04:00  170.089996  170.350006  167.539993  168.539993  48425700        0.0           0.0
2023-05-03 00:00:00-04:00  169.500000  170.919998  167.160004  167.449997  64566300        0.0           0.0
Explanation
This code uses the yfinance library in Python to retrieve financial data for a specific stock symbol (in this case, "AAPL" which represents Apple Inc.). It then prints detailed information about the stock symbol, retrieves historical OHLC (open, high, low, close) prices, and plots the historical prices using the matplotlib library.
Import the necessary libraries: yfinance, pandas, and matplotlib. The ticker object is then created using the Ticker method from yfinance, passing in the stock symbol "AAPL" as a parameter.
Next, the info variable is assigned the dictionary returned by the ticker.info method, which contains detailed information about the stock symbol, such as its name, sector, market cap, P/E ratio, and more. The code then prints this information in a readable format using a for loop and string formatting.
The history variable is assigned the DataFrame returned by the ticker.history method, which retrieves the historical OHLC prices, volume, and other financial data for the specified stock symbol over a specified time period (in this case, the past month). This data is then printed in a readable format.
Finally, the historical prices are plotted using matplotlib, with the x-axis representing the date and the y-axis representing the closing price. The plot is given a title and axis labels before being displayed using the show method.
Applications
Financial analysts ? May use Python and Yahoo Finance data to research companies, decide what to buy, and keep an eye on their portfolios.
Trading algorithms ? With real-time market data from Yahoo Finance, Python may be used to build trading algorithms that automatically purchase and sell stocks.
Data analysis ? Financial data may be statistically analyzed and visualized using Python with Yahoo Finance data.
Conclusion
For financial experts, investors, and traders, using Python to get financial data from Yahoo Finance is a potent tool. We can quickly access financial statements, dividend information, split information, and historical price data for any stock or financial instrument listed on Yahoo Finance by utilizing the yfinance library and the Ticker class. Python and Yahoo Finance are an essential tool for everyone working in the financial sector since there are countless opportunities for evaluating and utilizing this data.

4K+ Views
