 Data Structure
 Networking
 RDBMS
RDBMS Operating System
 Java
Java MS Excel
 iOS
iOS HTML
HTML CSS
CSS Android
 Python
 C Programming
 C++
C++ C#
C# MongoDB
 MySQL
MySQL Javascript
 PHP
PHP
- Selected Reading
- UPSC IAS Exams Notes
- Developer's Best Practices
- Questions and Answers
- Effective Resume Writing
- HR Interview Questions
- Computer Glossary
- Who is Who
Analyzing Census Data in Python
Census data is the source of information collected by the government to understand the population and its characteristics. It consists of details such as age, gender, education, and housing. This helps the government in understanding the current scenario as well as planning for the future.
In this article, we are going to learn how to analyze the census data in Python. Python, with its libraries like pandas, numpy, and matplotlib, is widely used for analyzing census data.
Analyzing Census Data
Here, we are going to use the sample data that consists of the census data stored in the file named "demo_2.csv". By using this data, we are going to perform different types of analysis.
demo_2.csv file| age | gender | education | worktype | income |
|---|---|---|---|---|
| 21 | Male | Bachelors | Private | 60000 |
| 24 | Female | Masters | Government | 72000 |
| 28 | Male | High-School | Self-employed | 35000 |
| 34 | Female | Bachelors | Private | 48000 |
| 39 | Male | Doctorate | Government | 90000 |
| 35 | Female | High-School | Self-employed | 32000 |
You can load the dataset by using the read_csv() function. It reads data from the CSV file and converts it into a dataframe. It is important to load data before starting any analysis to understand the structure of the data.
import pandas as pd
x=pd.read_csv("demo_2.csv")
print(x.head())
The output of the above program is as follows -
age  gender    education       worktype  income
0   21    Male    Bachelors        Private   60000
1   24  Female      Masters     Government   72000
2   28    Male  High-School  Self-employed   35000
3   34  Female    Bachelors        Private   48000
4   39    Male    Doctorate     Government   90000
Example 1
Let's look at the following example, where we are going to find and display all individuals aged above 30.
import pandas as pd
x=pd.read_csv("demo_2.csv")
y=x[x["age"]>30]
print(y.head())
The output of the above program is as follows -
   age  gender    education       worktype  income
3   34  Female    Bachelors        Private   48000
4   39    Male    Doctorate     Government   90000
5   35  Female  High-School  Self-employed   32000
Example 2
In this scenario, we are going to use the groupby() method to group the data based on the education level and then calculate the mean income by using the mean() method.
Consider the following example, where we are going to calculate the average income of the people grouped by their education level.
import pandas as pd
x=pd.read_csv("demo_2.csv")
result = x.groupby("education")["income"].mean()
print(result)
Following is the output of the above program -
education
Bachelors      54000.0
Doctorate      90000.0
High-School    33500.0
Masters        72000.0
Example 3
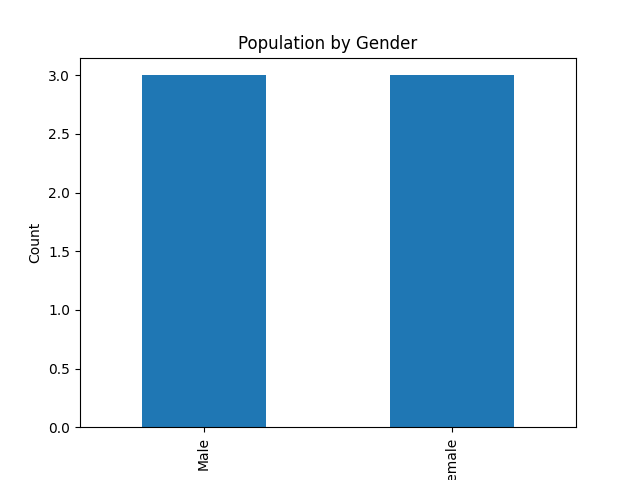
In this case, we are going to count the number of males and females by using the value_counts() method and plotting the bar chart with matplotlib.
Following is an example, where we are going to create a bar chart showing the number of males and females.
import pandas as pd
x=pd.read_csv("demo_2.csv")
import matplotlib.pyplot as plt
result = x["gender"].value_counts()
result.plot(kind="bar", title="Population by Gender")
plt.xlabel("Gender")
plt.ylabel("Count")
plt.show()
Following is the output of the above program -

Conclusion
Analyzing the census data in Python allows insights into population characteristics. Using programming constructs like pandas and matplotlib, we can:
- load and inspect data.
- Filter the data by conditions.
- Visualize the results for understanding.
With the help of Python, we can build complex data pipelines and interactive dashboards for large-scale census analysis.

