 Data Structure
 Networking
 RDBMS
RDBMS Operating System
 Java
Java MS Excel
 iOS
iOS HTML
HTML CSS
CSS Android
 Python
 C Programming
 C++
C++ C#
C# MongoDB
 MySQL
MySQL Javascript
 PHP
PHP
- Selected Reading
- UPSC IAS Exams Notes
- Developer's Best Practices
- Questions and Answers
- Effective Resume Writing
- HR Interview Questions
- Computer Glossary
- Who is Who
Analyze and Visualize Earthquake Data in Python with Matplotlib
Earthquakes are natural phenomena that can have effects on human life and infrastructure. With the availability of geospatial and seismic datasets, scientists and researchers can analyze and visualize the earthquake data to identify the patterns, trends, and risk zones.
Python, along with libraries like Matplotlib, Pandas, and NumPy, provides the tools to process and visualize the data. In this article, we are going to analyse and visualize earthquake data in Python with Matplotlib.
Analyzing and visualizing Earthquake
For the examples in this article, we use the dataset named "demo_1.csv" that contains information about the earthquakes.
The data is stored in rows and columns, where each row represents one earthquake event and the columns represent various types of that event.
demo_1.csv file:| time | latitude | longitude | depth | magnitude | place |
|---|---|---|---|---|---|
| 2025-05-12T14:32:10Z | 38.456 | 142.333 | 10.0 | 6.8 | Punjab |
| 2025-04-25T06:20:15Z | -6.212 | 100.840 | 70.0 | 5.8 | Delhi |
| 2025-03-17T03:45:30Z | 30.012 | -115.233 | 8.5 | 4.8 | Hyderabad |
| 2025-02-10T22:10:05Z | 35.789 | 138.342 | 12.2 | 5.2 | Mumbai |
| 2025-02-28T08:05:50Z | -33.453 | -70.456 | 32.0 | 6.4 | Goa |
Example 1
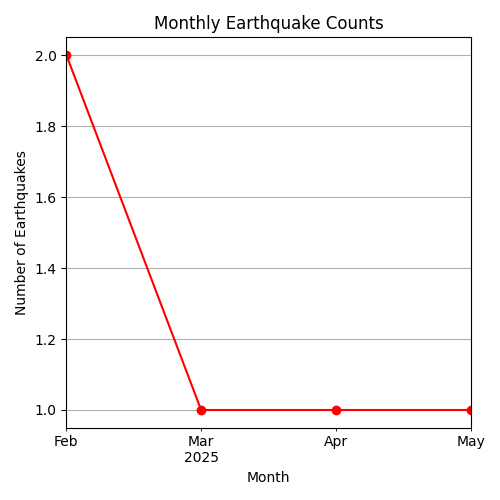
Let's look at the following example, where we are going to plot the number of earthquakes per month to observe the temporal trends (which denotes how earthquake occurrences change over time).
import pandas as pd
import matplotlib.pyplot as plt
x=pd.read_csv("demo_1.csv", sep='\t', parse_dates=['time'])
x['month']=x['time'].dt.to_period('M')
y=x.groupby('month').size()
plt.figure(figsize=(5,5))
y.plot(kind='line', marker='o', color='red')
plt.title('Monthly Earthquake Counts')
plt.xlabel('Month')
plt.ylabel('Number of Earthquakes')
plt.grid(True)
plt.tight_layout()
plt.show()
plt.tight_layout()
In this case, we are going to convert the time column into monthly periods using the dt.to_period('M') and counting the earthquakes per month.
The output of the above program is as follows -

Example 2
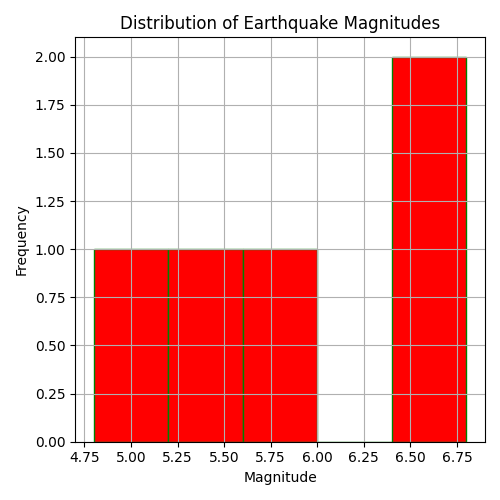
In the following example, we are going to visualize the distribution of earthquake magnitudes to understand how strong vs. mild earthquakes are.
import pandas as pd
import matplotlib.pyplot as plt
x=pd.read_csv("demo_1.csv", sep='\t')
plt.figure(figsize=(5, 5))
plt.hist(x['magnitude'], bins=5, color='red', edgecolor='green')
plt.title('Distribution of Earthquake Magnitudes')
plt.xlabel('Magnitude')
plt.ylabel('Frequency')
plt.grid(True)
plt.tight_layout()
plt.show()
Following is the output of the above program -

Example 3
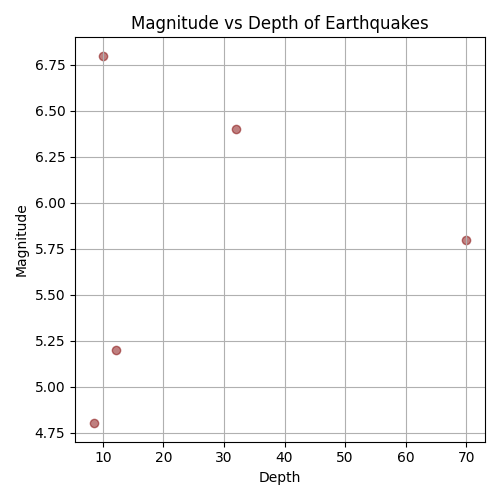
Following is an example, where we are going to scatter the plot of earthquake magnitude by depth.
import pandas as pd
import matplotlib.pyplot as plt
x=pd.read_csv("demo_1.csv", sep='\t')
plt.figure(figsize=(5, 5))
plt.scatter(x['depth'], x['magnitude'], color='maroon', alpha=0.5)
plt.title('Magnitude vs Depth of Earthquakes')
plt.xlabel('Depth')
plt.ylabel('Magnitude')
plt.grid(True)
plt.tight_layout()
plt.show()
If we run the above program, it will generate the following output -

Conclusion
Analyzing earthquake data with Python and Matplotlib allows us to detect patterns and support disaster awareness strategies. With a few lines of program, we are transforming the complex data into natural visuals for both technical and non-technical members.
By using libraries like pandas for data manipulation and Matplotlib for visualization, Python remains an essential tool for data analysis and visualization tasks.

