 Data Structure
 Networking
 RDBMS
RDBMS Operating System
 Java
Java MS Excel
 iOS
iOS HTML
HTML CSS
CSS Android
 Python
 C Programming
 C++
C++ C#
C# MongoDB
 MySQL
MySQL Javascript
 PHP
PHP
- Selected Reading
- UPSC IAS Exams Notes
- Developer's Best Practices
- Questions and Answers
- Effective Resume Writing
- HR Interview Questions
- Computer Glossary
- Who is Who
How can Tensorflow be used to visualize the data using Python?
Let's say we have flower dataset. The flower dataset can be downloaded using a google API that basically links to the flower dataset. The ‘get_file’ method can be used to pass the API as a parameter. Once this is done, the data gets downloaded into the environment.
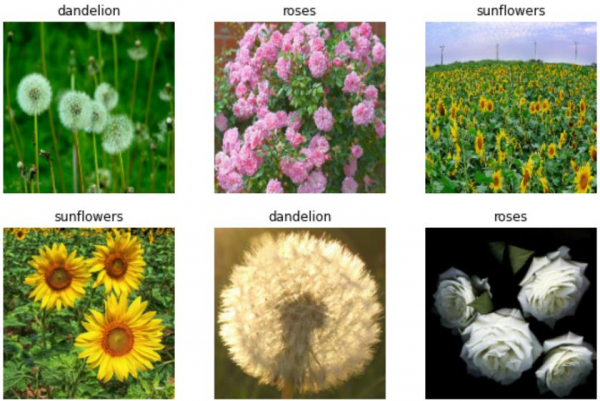
It can be visualized using the ‘matplotlib’ library. The ‘imshow’ method is used to display the image on the console.
Read More: What is TensorFlow and how Keras work with TensorFlow to create Neural Networks?
We will use the Keras Sequential API, which is helpful in building a sequential model that is used to work with a plain stack of layers, where every layer has exactly one input tensor and one output tensor.
An image classifier is created using a keras.Sequential model, and data is loaded using preprocessing.image_dataset_from_directory. Data is efficiently loaded off disk. Overfitting is identified and techniques are applied to mitigate it. These techniques include data augmentation, and dropout. There are images of 3700 flowers. This dataset contaisn 5 sub directories, and there is one sub directory per class. They are:
- daisy,
- dandelion,
- roses,
- sunflowers, and
- tulips.
We are using the Google Colaboratory to run the below code. Google Colab or Colaboratory helps run Python code over the browser and requires zero configuration and free access to GPUs (Graphical Processing Units). Colaboratory has been built on top of Jupyter Notebook.
print("Visualizing the dataset")
import matplotlib.pyplot as plt
plt.figure(figsize=(10, 10))
for images, labels in train_ds.take(1):
   for i in range(6):
      ax = plt.subplot(3, 3, i + 1)
      plt.imshow(images[i].numpy().astype("uint8"))
      plt.title(class_names[labels[i]])
      plt.axis("off")

for image_batch, labels_batch in train_ds:
   print(image_batch.shape)
   print(labels_batch.shape)
   break
Code credit: https://www.tensorflow.org/tutorials/images/classification
Output
Visualizing the dataset
(32, 180, 180, 3)
(32,)

Explanation
- Once the data is trained by using the fit method, the dataset can also be manually iterated over, to retrieve batches of images.
- This data is displayed on the console.
- The image_batch is a tensor of the shape (32, 180, 180, 3).
- This is a batch of 32 images of shape 180x180x3.
- The label_batch is a tensor of the shape (32,), and these are corresponding labels to the 32 images.
- The .numpy() can be called on the image_batch and labels_batch tensors to convert them to a numpy.ndarray.

