 Data Structure
 Networking
 RDBMS
RDBMS Operating System
 Java
Java MS Excel
 iOS
iOS HTML
HTML CSS
CSS Android
 Python
 C Programming
 C++
C++ C#
C# MongoDB
 MySQL
MySQL Javascript
 PHP
PHP
- Selected Reading
- UPSC IAS Exams Notes
- Developer's Best Practices
- Questions and Answers
- Effective Resume Writing
- HR Interview Questions
- Computer Glossary
- Who is Who
How to Visualize API results with Python
Introduction..
One of the biggest advantage of writing an API is to extract current/live data, even when the data is rapidly changing, an API will always get up to date data. API programs will use very specific URLs to request certain information e.g. Topp 100 most played songs of 2020 in Spotify or Youtube Music. The requested data will be returned in an easily processed format, such as JSON or CSV.
Python allows the user to write API calls to almost any URL you can think of. In this example I will show how to extract API results from GitHub and visualize them.
Note - The plan was to show API results from Spotify, but Spotify requires more pre-requisites which might require more than 1 post, so we will stick with GitHUb for this post.
Github, Often called as developers Facebook allows us to write API calls to extract wide variety of data. Assume you wanted to search Javascript Github repositories with more stars. GitHub does not require an API Key while other might want to.
How to do it..
1. Install requests package by opening up the python command prompt and firing pip install requests.
import requests

# set the siteurl
site_url = 'https://api.github.com/search/repositories?q=language:javascript&sort=stars'

# set the headers
headers = {'Accept': 'application/vnd.github.v3+json'}

# call the url and save the response
response = requests.get(site_url, headers=headers)

# Get the response
print(f"Output \n *** Response from {site_url} is {response.status_code} ")
Output
*** Response from https://api.github.com/search/repositories?q=language:javascript&sort=stars is 200
2. The API returns the information in JSON format, so we need to use the json() method to convert the information to a Python dictionary.
Example
response_json = response.json()
print(f"Output \n *** keys in the Json file \n {response_json.keys()} \n")

print(f" *** Total javascript repositories in GitHub \n {response_json['total_count']}" )
Output
*** keys in the Json file
dict_keys(['total_count', 'incomplete_results', 'items'])

*** Total javascript repositories in GitHub
11199577
So, we have 3 keys out of which we can ignore incomplete_results. Let us examine our first repository now.
Example
repositories = response_json['items']
first_repo = repositories[0]

print(f"Output \n *** Repository information keys total - {len(first_repo)} - values are -\n")
for keys in sorted(first_repo.keys()):
print(keys)

print(f" *** Repository name - {first_repo['name']}, Owner - {first_repo['owner']['login']}, total watchers - {first_repo['watchers_count']} ")
Output
*** Repository information keys total - 74 - values are -

archive_url
archived
assignees_url
blobs_url
branches_url
clone_url
collaborators_url
comments_url
commits_url
compare_url
contents_url
contributors_url
created_at
default_branch
deployments_url
description
disabled
downloads_url
events_url
fork
forks
forks_count
forks_url
full_name
git_commits_url
git_refs_url
git_tags_url
git_url
has_downloads
has_issues
has_pages
has_projects
has_wiki
homepage
hooks_url
html_url
id
issue_comment_url
issue_events_url
issues_url
keys_url
labels_url
language
languages_url
license
merges_url
milestones_url
mirror_url
name
node_id
notifications_url
open_issues
open_issues_count
owner
private
pulls_url
pushed_at
releases_url
score
size
ssh_url
stargazers_count
stargazers_url
statuses_url
subscribers_url
subscription_url
svn_url
tags_url
teams_url
trees_url
updated_at
url
watchers
watchers_count
*** Repository name - freeCodeCamp, Owner - freeCodeCamp, total watchers - 316079
4. Time for visualization, there is lot of information to digest, so the best way is to visualize the results. Remember - "A picture is worth a thousand words".
I have already covered matplotlib in othere posts, so for a change we will chart using plotly.
Install the module - plotly. We will begin with importing plotly.
Example
from plotly.graph_objs import Bar
from plotly import offline
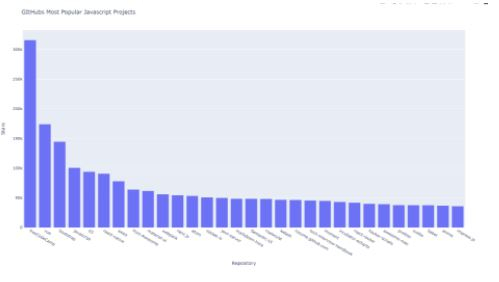
6. We will do a bar chart with repositories vs number of stars. The more the stars the more popular the repository is. So good way to see who is on top. So, we need two variables repository names and number of stars.
In[6]:
Example
repo_names, repo_stars = [], []
for repo_info in repositories:
repo_names.append(repo_info['name'])
repo_stars.append(repo_info['stargazers_count'])
7. Start the visualization by preparing the data list.This contains a dictionary, which defines the type of the plot and provides the data for the x- and y-values. You might have already guessed, yes we will use x-axis to plot project names and y-axis for plotting stars.
Example
data_plots = [{'type' : 'bar', 'x':repo_names , 'y': repo_stars}]
8. We will add the titles for x-axis, y-axis and also for the chart as a whole.
Example
layout = {'title': 'GItHubs Most Popular Javascript Projects',
'xaxis': {'title': 'Repository'},
'yaxis': {'title': 'Stars'}}
9. Time for plotting.
import requests
from plotly.graph_objs import Bar
from plotly import offline

site_url = 'https://api.github.com/search/repositories?q=language:javascript&sort=stars'

headers = {'Accept': 'application/vnd.github.v3+json'}
response = requests.get(site_url, headers=headers)
response_json = response.json()

repo_names, repo_stars = [], []
for repo_info in repositories:
repo_names.append(repo_info['name'])
repo_stars.append(repo_info['stargazers_count'])

data_plots = [{'type' : 'bar', 'x':repo_names , 'y': repo_stars}]
layout = {'title': 'GItHubs Most Popular Javascript Projects',
'xaxis': {'title': 'Repository'},
'yaxis': {'title': 'Stars'}}

fig = {'data': data_plots, 'layout': layout}
offline.plot(fig, filename='Most_Popular_JavaScript_Repos.html')
Example
'Most_Popular_JavaScript_Repos.html'
Output
Most_Popular_JavaScript_Repos.html will be created in the same directory as the code with below output.


