
Article Categories
- All Categories
-
 Data Structure
-
 Networking
-
 RDBMS
RDBMS
-
 Operating System
-
 Java
Java
-
 MS Excel
-
 iOS
iOS
-
 HTML
HTML
-
 CSS
CSS
-
 Android
-
 Python
-
 C Programming
-
 C++
C++
-
 C#
C#
-
 MongoDB
-
 MySQL
MySQL
-
 Javascript
-
 PHP
PHP
-
 Economics & Finance
How to Analyze Survey Data in Excel?
When we conduct any surveys and collect the information and store it in Excel, it can be a very complex problem to analyse it manually, but by following this simple process, we can analyse the data present in the Excel sheet. This process mainly contains three steps: first, count the number of different opinions, then calculate the percentage of each result, and finally, create the survey report. This tutorial will help you understand how we can analyze the survey data in Excel.
Analyzing Survey Data in Excel
Here we will first find the number of blank cells and then calculate the occurrence of every event. Let's see a simple process to understand how we can analyse survey data in Excel in a simple and fast method.
Step 1
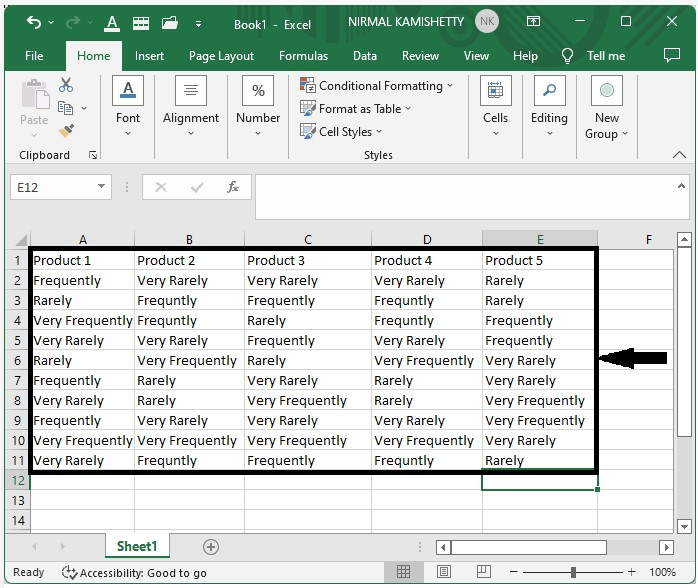
Assume we have an Excel sheet that represents the survey data, similar to the one in the image below.
Step 2
Now count the total number of survey responses.
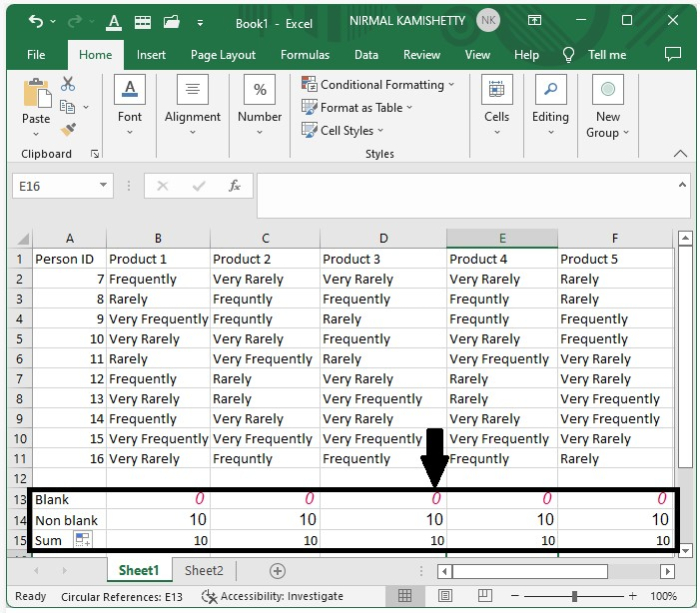
To get the total number of black cells in the excel, click on an empty cell and enter the formula =COUNTBLANK(B2:B11), then click OK to get the first result, and then we can get all the other results by dragging the cell around.
Then, in Excel, enter the formula =COUNTA(B2:B11) to the total number of filled cells, and then sum them both using the formula =SUM(B13:B14) to get the total number of responses from the survey, and our final result will look like the image below.
Step 2
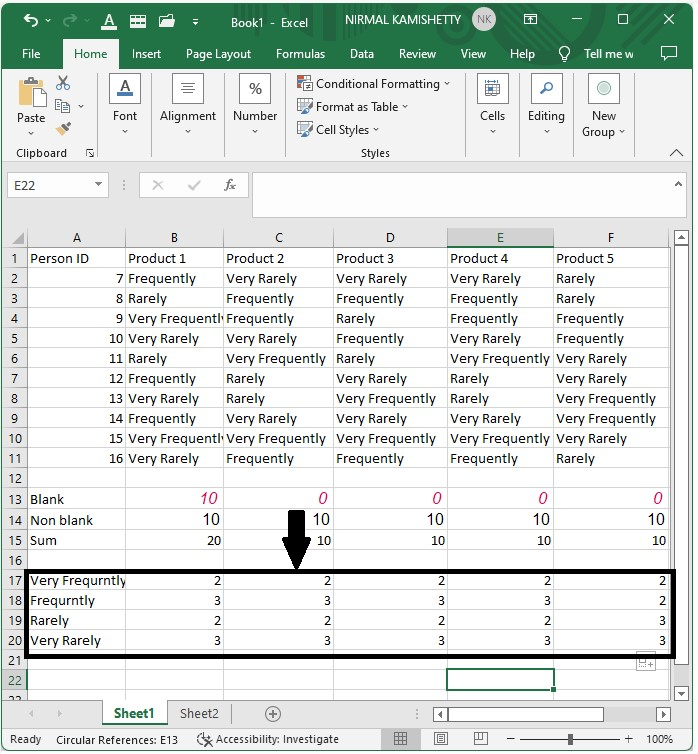
Now, to get the number of results for each option, click on an empty cell and enter the formula =COUNTIF(B2:B11, $B$10) to get the first result very frequently, then drag until all the results are filled.
To get the results for frequently, rarely, and very rarely, enter the formulas =COUNTIF(B2:B11, $B$9), =COUNTIF(B2:B11, $B$3), and =COUNTIF(B2:B11, $B$8), and our result will look like the image below.
Step 3
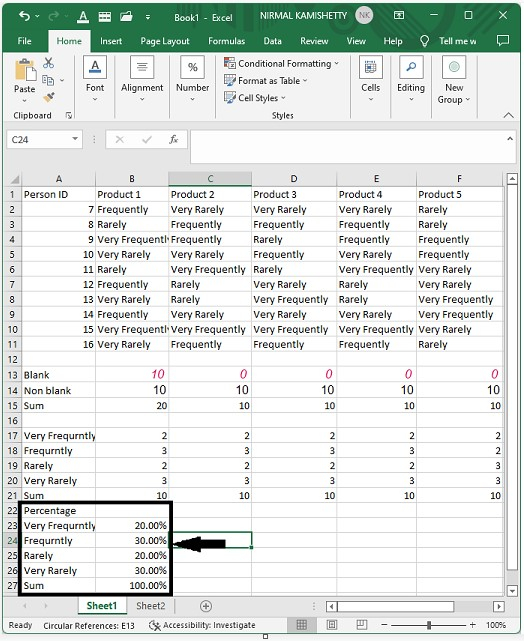
Now to calculate the percentage. Enter the formula =B17/B21 into an empty cell, then press Enter and drag to get all results.
Our results will be in decimals, but we can change them by selecting the data, right-clicking, selecting format cells, selecting percentage, and clicking on "OK" to get the results in percentage as shown in the below image.
Step 4
Now to display the data, select what data you want to represent in the sheet, copy the data, and in the new work sheet, select paste special under paste, select the transpose check box, and click on ok to get our final result.
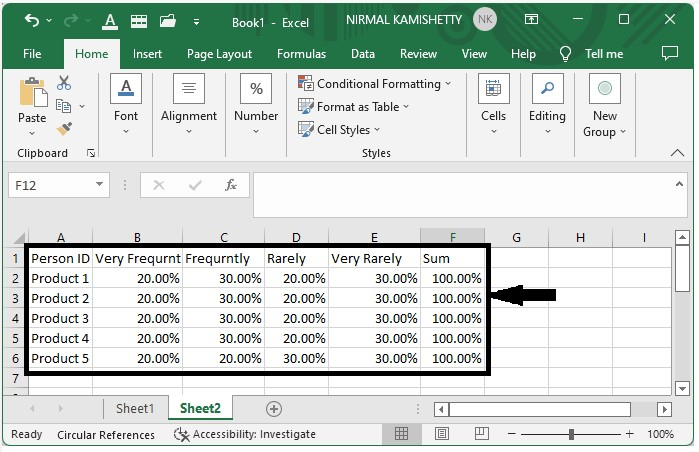
Conclusion
In this tutorial, we used a simple example to demonstrate how you can analyse survey data in Excel to highlight particular sets of data.

4K+ Views
