- Amazon RDS - Home
- Amazon RDS - Overview
- Amazon RDS - Environment
- Amazon RDS - Interfaces
- Amazon RDS - DB Instances
- Amazon RDS - DB Storages
- Amazon RDS - MS SQL features
- Amazon RDS - MS SQL creating DB
- Amazon RDS - MS SQL Connecting to DB
- Amazon RDS - MS SQL DB Export Import
- Amazon RDS - MS SQL DB with SSL
- Amazon RDS - MS SQL DBA Tasks
- Amazon RDS - Oracle Features
- Amazon RDS - Oracle Creating DB
- Amazon RDS - Oracle Connecting to DB
- Amazon RDS - Oracle DB Data Import
- Amazon RDS - Oracle DBA Tasks
- Amazon RDS - MariaDB Features
- Amazon RDS - MariaDB Creating DB
- Amazon RDS - MariaDB Connecting to DB
- Amazon RDS - MariaDB Data Import
- Amazon RDS - PostgreSQL Features
- Amazon RDS - PostgreSQL creating DB
- Amazon RDS - PostgreSQL Connecting to DB
- Amazon RDS - PostgreSQL Data Import
- Amazon RDS - MySQL Features
- Amazon RDS - MySQL Creating DB
- Amazon RDS - MySQL Connecting to DB
- Amazon RDS - MySQL DB Export Import
- Amazon RDS - MySQL DBA Tasks
- Amazon RDS - Multi-AZ Deployments
- Amazon RDS - DB Snapshots
- Amazon RDS - DB Monitoring
- Amazon RDS - Event Notifications
- Amazon RDS - DB Access Control
Amazon RDS - DB Monitoring
In order to maintain the reliability, availability, and performance of Amazon RDS, we need to collect monitoring data so that we can easily debug a multi-point failure. With Amazon RDS, you can monitor network throughput, I/O for read, write, and/or metadata operations, client connections, and burst credit balances for your DB instances. We should also consider storing historical monitoring data. This stored data will give you a baseline to compare against with current performance data.
Below are examples of some monitoring data and how they help in maintaining healthy RDS instances.
High CPU or RAM consumption High values for CPU or RAM consumption might be appropriate, provided that they are in keeping with your goals for your application (like throughput or concurrency) and are expected.
Disk space consumption Investigate disk space consumption if space used is consistently at or above 85 percent of the total disk space. See if it is possible to delete data from the instance or archive data to a different system to free up space.
Network traffic For network traffic, talk with your system administrator to understand what expected throughput is for your domain network and Internet connection. Investigate network traffic if throughput is consistently lower than expected.
Database connections Consider constraining database connections if you see high numbers of user connections in conjunction with decreases in instance performance and response time.
IOPS metrics The expected values for IOPS metrics depend on disk specification and server configuration, so use your baseline to know what is typical. Investigate if values are consistently different than your baseline. For best IOPS performance, make sure your typical working set will fit into memory to minimize read and write operations.
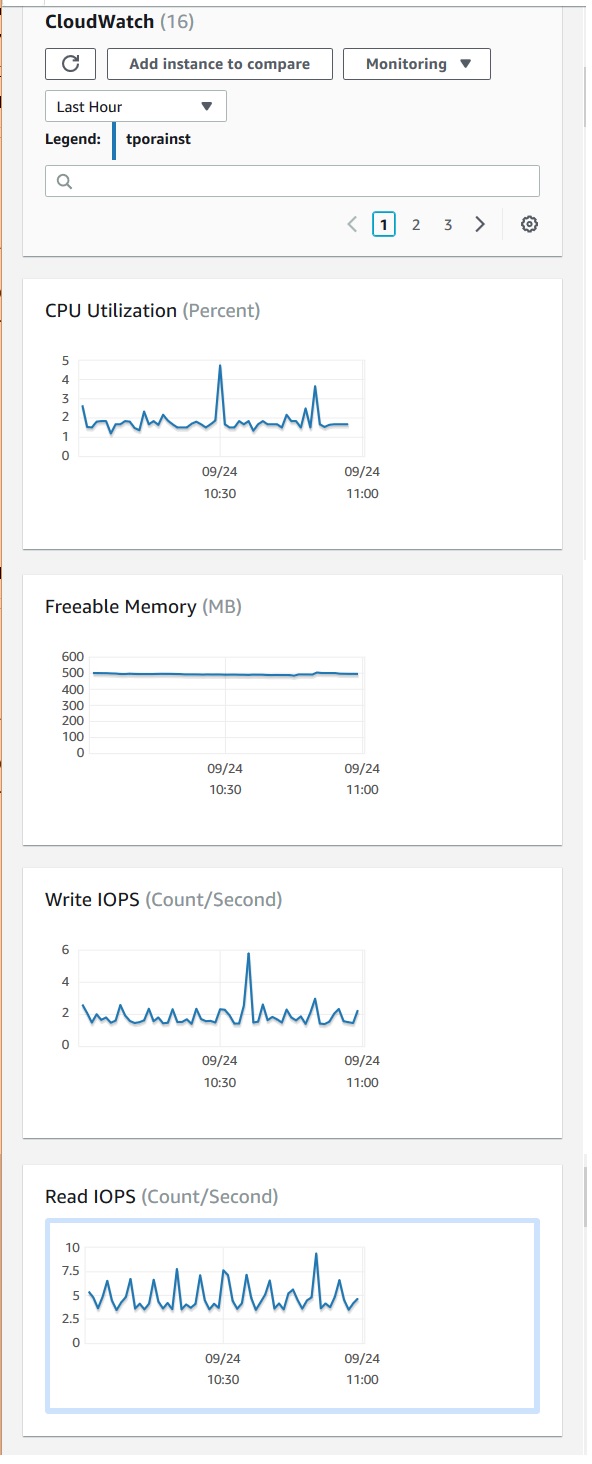
Monitoring with Amazon CloudWatch
Amazon RDS sends metrics and dimensions to Amazon CloudWatch every minute. We can monitor these metrices from the AWS console as shown in the below diagrams.