- Seaborn Tutorial
- Seaborn - Home
- Seaborn - Introduction
- Seaborn - Environment Setup
- Importing Datasets and Libraries
- Seaborn - Figure Aesthetic
- Seaborn- Color Palette
- Seaborn - Histogram
- Seaborn - Kernel Density Estimates
- Visualizing Pairwise Relationship
- Seaborn - Plotting Categorical Data
- Distribution of Observations
- Seaborn - Statistical Estimation
- Seaborn - Plotting Wide Form Data
- Multi Panel Categorical Plots
- Seaborn - Linear Relationships
- Seaborn - Facet Grid
- Seaborn - Pair Grid
- Function Reference
- Seaborn - Function Reference
- Seaborn Useful Resources
- Seaborn - Quick Guide
- Seaborn - Useful Resources
- Seaborn - Discussion
Seaborn.rugplot() method
The Seaborn.rugplot() method is used to plot marginal distributions and allows to draw ticks along the x and y axes. By clearly displaying the locations of individual observations, this function is meant to supplement existing displays.
So the rugplot() method essentially add rugs or ticks along an already existing plot.
But what is a rug plot? A rug plot is a graph that plots data for single quantitative values that is displayed as marks along the axes. These plots are usually used for two-dimensional scatter plots by marking the rug plot of x values along the x-axis and rug plot of y values along the y-axis.
Syntax
Following is the syntax of the Seaborn.rugplot() method −
seaborn.rugplot(x=None, *, height=0.025, axis=None, ax=None, data=None, y=None, hue=None, palette=None, hue_order=None, hue_norm=None, expand_margins=True, legend=True, a=None, **kwargs
Parameters
Some of the parameters of this method are discussed below.
| S.No | Parameter and Description |
|---|---|
| 1 | x,y Variables that are represented on the x,y axis. |
| 2 | Data This is used to pass the dataset being used for plotting. |
| 3 | Height This parameter takes the value that determines the proportion of the axes extent covered by each rug element. |
| 4 | Palette This parameter sets the color of the plot when hue mapping is considered too. |
| 5 | Hue_order The order of plotting the categorical variables in hue semantic. |
| 6 | Hue_norm Used to set normalization range in data units for hue semantic. A pair of data values are provided. |
| 7 | Ax Pre-existing axes for plots are expected to be passed through this argument. |
| 8 | Expand_margins Takes Boolean value and if True is passed then the axes' margins should be increased by the rug's height to prevent element overlap. |
| 9 | Legend Boolean value. If false, does not print out the legend of semantic variables. |
Return Value
This method returns the matplotlib axes containing the plot points.
Loading the seaborn library
let us load the seaborn library and the dataset before moving on to the developing the plots. To load or import the seaborn library the following line of code can be used.
Import seaborn as sns
Loading the dataset
In this article, we will make use of the Tips dataset inbuilt in the seaborn library. the following command is used to load the dataset.
tips=sns.load_dataset("tips")
The below mentioned command is used to view the first 5 rows in the dataset. This enables us to understand what variables can be used to plot a graph.
tips.head()
The below is the output for the above piece of code.
index,total_bill,tip,sex,smoker,day,time,size
0,16.99,1.01,Female,No,Sun,Dinner,2
1,10.34,1.66,Male,No,Sun,Dinner,3
2,21.01,3.5,Male,No,Sun,Dinner,3
3,23.68,3.31,Male,No,Sun,Dinner,2
4,24.59,3.61,Female,No,Sun,Dinner,4
Now that we have loaded the data, we will move on to plotting the data.
Example 1
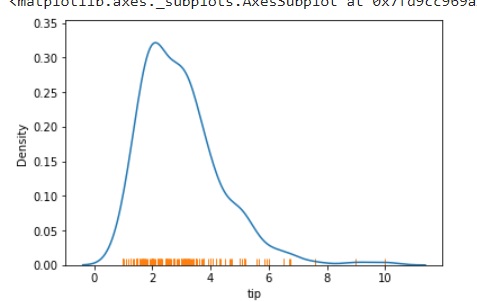
In this example, we will see how to add rug along one axis in the plot. To do so for x axis the code is mentioned below.
import seaborn as sns
import matplotlib.pyplot as plt
tips=sns.load_dataset("tips")
tips.head()
sns.kdeplot(data=tips, x="tip")
sns.rugplot(data=tips, x="tip")
plt.show()
Output
The plot will look like the figure shown below.
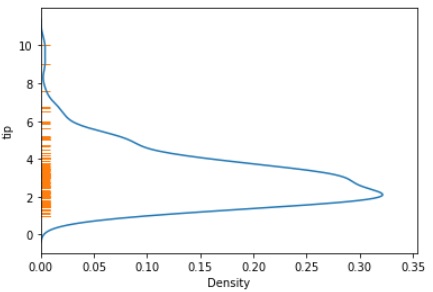
To make a rug along the y axis, the code below can be used.
import seaborn as sns
import matplotlib.pyplot as plt
tips=sns.load_dataset("tips")
tips.head()
sns.kdeplot(data=tips, y="tip")
sns.rugplot(data=tips, y="tip")
plt.show()
the plot will look like the figure displayed below.
Example 2
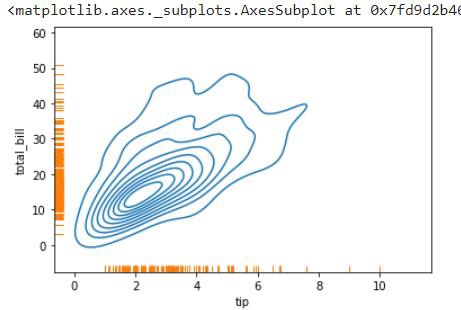
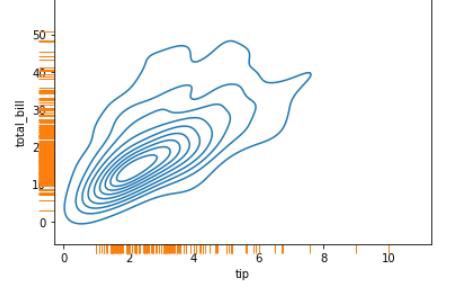
In this example, we will understand how to run a rug along both axes in a given plot.
import seaborn as sns
import matplotlib.pyplot as plt
tips=sns.load_dataset("tips")
tips.head()
sns.kdeplot(data=tips, x="tip",y="total_bill")
sns.rugplot(data=tips, x="tip",y="total_bill")
plt.show()
Output
the plot will look like the figure mentioned below.
Example 3
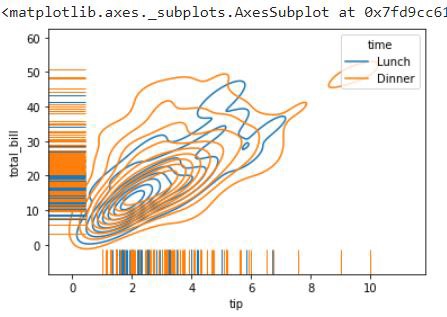
In scenarios where you need to draw a taller rug along the axes of the plot and also represent the hue mapping the below code can be used. Here, the height parameter can be used to specify the height of the rug and hue parameter is used to specify the hue mapping.
import seaborn as sns
import matplotlib.pyplot as plt
tips=sns.load_dataset("tips")
tips.head()
sns.kdeplot(data=tips, x="tip",y="total_bill",hue="time")
sns.rugplot(data=tips, x="tip",y="total_bill",hue="time",height=.1)
plt.show()
Output
the plot for this scenario can be seen below.
Example 4
To make sure that the rug is outside the axes and not inside the plot. The clip_on parameter can be used. It takes Boolean values and if False, it puts the rug outside the axes.
import seaborn as sns
import matplotlib.pyplot as plt
tips=sns.load_dataset("tips")
tips.head()
sns.kdeplot(data=tips, x="tip",y="total_bill")
sns.rugplot(data=tips, x="tip",y="total_bill",height=-0.04,clip_on=False)
plt.show()
Output
The output for this code is as follows
In this way, rugplot() method and its parameters can be used.
To Continue Learning Please Login