- Seaborn Tutorial
- Seaborn - Home
- Seaborn - Introduction
- Seaborn - Environment Setup
- Importing Datasets and Libraries
- Seaborn - Figure Aesthetic
- Seaborn- Color Palette
- Seaborn - Histogram
- Seaborn - Kernel Density Estimates
- Visualizing Pairwise Relationship
- Seaborn - Plotting Categorical Data
- Distribution of Observations
- Seaborn - Statistical Estimation
- Seaborn - Plotting Wide Form Data
- Multi Panel Categorical Plots
- Seaborn - Linear Relationships
- Seaborn - Facet Grid
- Seaborn - Pair Grid
- Function Reference
- Seaborn - Function Reference
- Seaborn Useful Resources
- Seaborn - Quick Guide
- Seaborn - Useful Resources
- Seaborn - Discussion
Seaborn.move_legend() method
A legend in a graph or plot is the page or, part of a graph which helps/explains how to interpret/understand a graph. The Seaborn.move_legend() method is used to recreate a plot’s legend to a new place.
You cannot access the positional parameters of the legends of the Matplotlib therefore, though the name suggests that this method moves the legend, it actually copies the information of the legend recreates it in a new position and removes the old one.
Syntax
Following is the syntax of the seaborn.move_legend() method −
seaborn.move_legend(obj, loc, **kwargs)
Parameters
Parameters of the move_legend() method are described below.
| S.No | Name and Description |
|---|---|
| 1 | Obj This is the object associated with the plot. |
| 2 | Loc This argument takes an string or an integer and it is the location argument. |
| 3 | Kwargs Other arguments can be passed. |
The loc parameter takes the values such as center right, center left, upper right, upper left, lower left, lower right, right, lower center, upper center, and center. And other kwargs that can be passed are a part of the matplotlib legend method.
To understand how to use this, we will need to draw plots and in order to do that we will have to import inbuilt daatsets from the library.
Let us load the seaborn library and the dataset before moving on to developing the plots.
Loading the seaborn library
To load or import the seaborn library the following line of code can be used.
Import seaborn as sns
Loading the dataset
In this article, we will make use of the Titanic dataset inbuilt in the seaborn library. the following command is used to load the dataset.
titanic=sns.load_dataset("titanic")
The below mentioned command is used to view the first 5 rows in the dataset. This enables us to understand what variables can be used to plot a graph.
titanic.head()
The below is the output for the above piece of code.
index,survived,pclass,sex,age,sibsp,parch,fare,embarked,class,who,adult_male,deck,embark_town,alive,alone
0,0,3,male,22.0,1,0,7.25,S,Third,man,true,NaN,Southampton,no,false
1,1,1,female,38.0,1,0,71.2833,C,First,woman,false,C,Cherbourg,yes,false
2,1,3,female,26.0,0,0,7.925,S,Third,woman,false,NaN,Southampton,yes,true
Now that we have loaded the dataset, we will explore as few examples.
Example 1
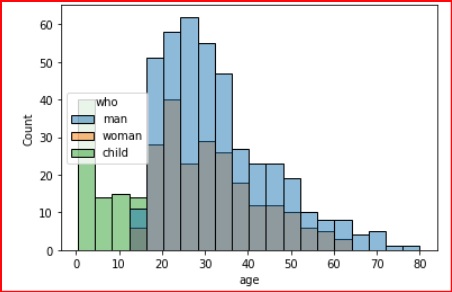
In this example, we will understand how the move_legend() method can be used to change the position of the legend. In this example, we will pass one of the positions ot the loc term and then observe how the legend changes in the plot displayed.
import seaborn as sns
import matplotlib.pyplot as plt
titanic=sns.load_dataset("titanic")
titanic.head()
ax = sns.histplot(titanic, x="age", hue="who")
sns.move_legend(ax, "center left")
plt.show()
Output
the output produced is as follows,
Example 2
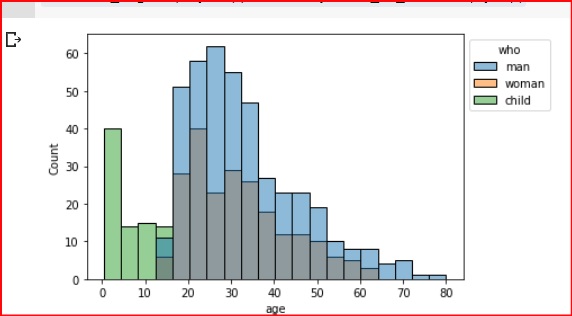
In this example, we will legend to the upperleft of the plot. And since bbox_to_anchor is set to (1,1) the legend is moved outside the plot boundary. This parameter is used for fine grind control such as moving the legend out of the box.
import seaborn as sns
import matplotlib.pyplot as plt
titanic=sns.load_dataset("titanic")
titanic.head()
ax = sns.histplot(titanic, x="age", hue="who")
sns.move_legend(ax, "upper left", bbox_to_anchor=(1, 1))
plt.show()
Output
the output produced is as follows,
Example 3
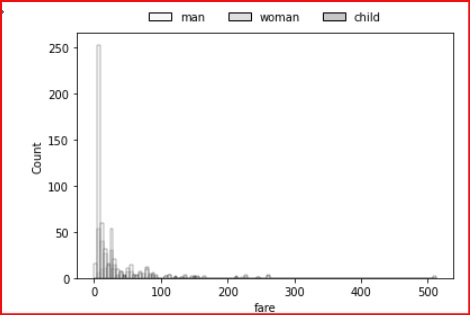
in this example, we will add some properties to the legend so as to change its appearance. The following lines of code can be used to obtain a legend that is shown in the figure below.
import seaborn as sns
import matplotlib.pyplot as plt
titanic=sns.load_dataset("titanic")
titanic.head()
ax = sns.histplot(titanic, x="age", hue="who")
sns.move_legend(ax, "lower center", bbox_to_anchor=(.5, 1), ncol=3, title=None, frameon=False)
plt.show()
Output
The output for the above lines of code, where the properties of the legend have been changed a little to make it look more stylist is shown below.
To Continue Learning Please Login