- Intellij Idea Tutorial
- Intellij Idea - Home
- Intellij Idea - Introduction
- Installation and Configuration
- Intellij Idea − Getting Familiar
- Create First Java Project
- Intellij Idea − Deep Dive
- Intellij Idea − Deep Dive into Editor
- Intellij Idea − Code Refactoring
- Intellij Idea − Running Projects
- Intellij Idea − Build Tools
- Intellij Idea − Unit Testing
- Intellij Idea − Debugging
- Intellij Idea − Profiling
- Intellij Idea − Version Control
- Intellij Idea − Databases
- Migrating from NetBeans
- Intellij Idea − Migrating from Eclipse
- Intellij Idea Resources
- Intellij Idea - Quick Guide
- Intellij Idea - Useful Resources
- Intellij Idea - Discussion
Intellij Idea - Profiling
Profiler gives insights about your application like its CPU, memory and heap usage. It also gives details about the application threads. This chapter discusses the usage of VisualVM tool for Java application profiling. It can profile entities such as CPU and heap.
It is recommended that the readers of this tutorial are familiar with the application profiler concepts.
Introduction
VisualVM is a visual tool that integrates JDK tools and gives you powerful profiling capabilities. It allows you to generate and analyze heap data, track down memory leaks,monitor the garbage collector and perform memory and CPU profiling.
Benefits
Visual interface for local and remote Java applications running on JVM.
Monitoring of application’s memory usage and application’s runtime behavior.
Monitoring of application threads
Analyzing the memory allocations to different applications.
Thread dumps − very handy in case of deadlocks and race conditions.
Heap dumps − very handy in analyzing the heap memory allocation.
Configuration
In this section, we will learn the steps performed to configure VisualVM. The steps are as follow −
Download it from here.
Extract the zip file.
Navigate to etc/visualvm.conf file and add the following line in this file −
visualvm_jdkhome=<path of JDK>
If your JDK is installed in the C:\Program Files\Java\jdk-9.0.1 directory then it should look like this −
visualvm_jdkhome="C:\Program Files\Java\jdk-9.0.1"
Monitoring application
Let us now see how to monitor the application. Consider the following steps to understand the same −
- Double-click on the visualvm.exe file.
- Select the application from left pane.
- Select the monitor tab.
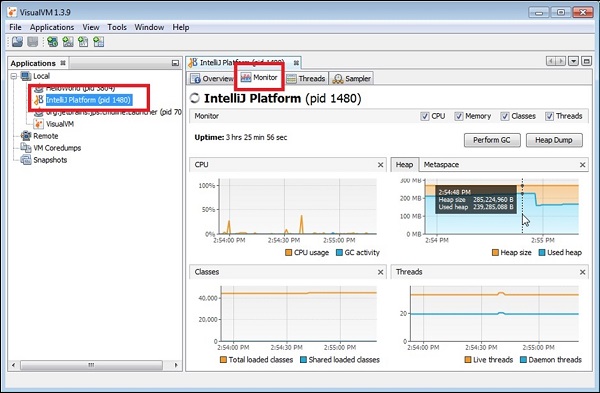
You will be directed to a window where you will get the details about CPU, Heap, Classes and threads. To be specific with the usage, hover the mouse over any graph. We can see the usage of Heap in the above screenshot.
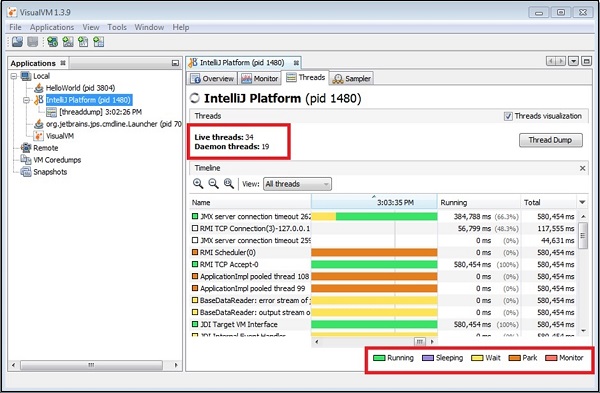
Insights about Threads
Java application can contain multiple threads of execution. To know more about threads, select the Threads tab of a particular application. It will give various statistics about threads like number of live threads and daemon threads. The different thread states are Running, Sleeping, Waiting, Park and Monitor.
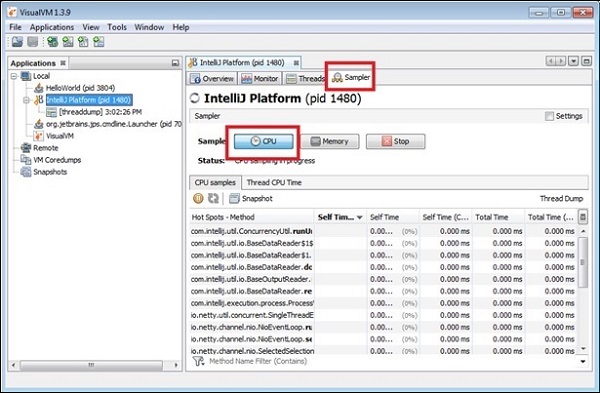
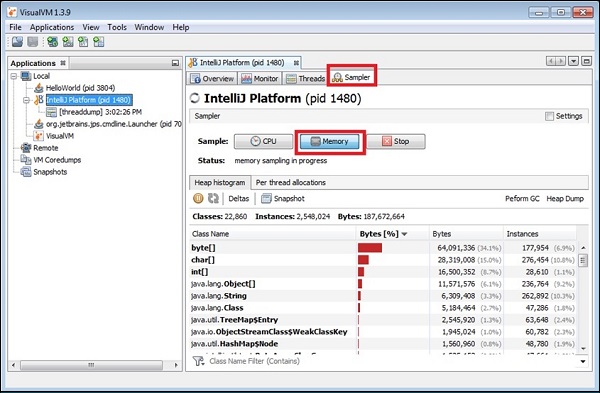
Sampling Application
VisualVM supports CPU, memory sampling and memory leak detection. To sample application, select application and choose the sample tab −
CPU sampling
For CPU sampling, click on the CPU button as show in the following screenshot −
Memory profiling
For memory profiling, click on the Memory button as shown in the following screenshot −
Memory leaks
A memory leak occurs when an application, while running, slowly fills up the heap with objects that are not automatically deleted by the program.
If an object that is not used by the program is not deleted, then it remains in memory and the GC cannot reclaim its space. If the number of bytes and number of instances in your application were to increase constantly and significantly in your program to the point of using up all the space, this can be an indication of a memory leak.
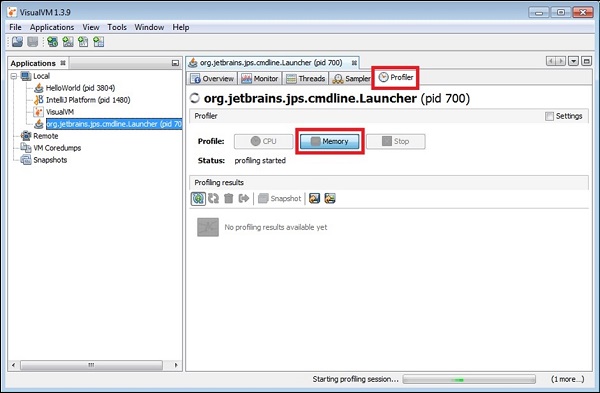
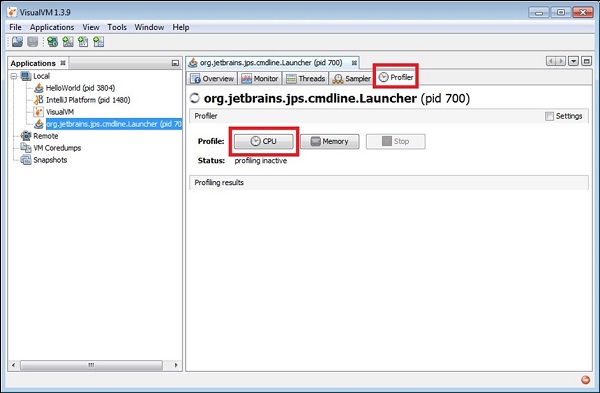
Profiling application
In this section, we will learn how to profile an application. To profile an application, select application from left pane and click the profile tab −
CPU profiling
To perform CPU profiling, click on the CPU button as shown in the screenshot below −
Memory profiling
To perform CPU profiling, click on the CPU button as shown in the screenshot below −