- Intellij Idea Tutorial
- Intellij Idea - Home
- Intellij Idea - Introduction
- Installation and Configuration
- Intellij Idea − Getting Familiar
- Create First Java Project
- Intellij Idea − Deep Dive
- Intellij Idea − Deep Dive into Editor
- Intellij Idea − Code Refactoring
- Intellij Idea − Running Projects
- Intellij Idea − Build Tools
- Intellij Idea − Unit Testing
- Intellij Idea − Debugging
- Intellij Idea − Profiling
- Intellij Idea − Version Control
- Intellij Idea − Databases
- Migrating from NetBeans
- Intellij Idea − Migrating from Eclipse
- Intellij Idea Resources
- Intellij Idea - Quick Guide
- Intellij Idea - Useful Resources
- Intellij Idea - Discussion
Intellij Idea - Deep Dive into Editor
Editor is that area where a developer spends most of his/her time. Mastering the editor is the first step at improving the productivity of any resource. This chapter discusses visual elements of editor, the most common editor actions and SonarLint plug-in, which provides lint checking.
Visual Elements of Editor
IntelliJ has many provisions that include visual elements designed to assist developers in navigating through and understanding the real status of their coding.
Let us now go through the different provision −
Gutter Area
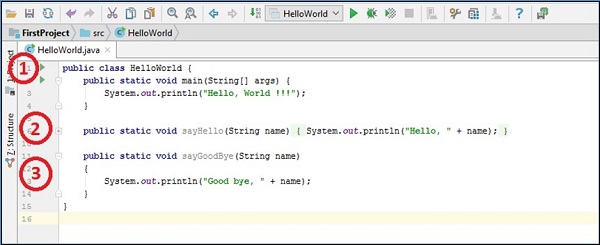
Editor’s gutter area is located on the left side of IDE as shown in the following image −
Labels
We will now understand how the labels work. The above screenshot is marked in numbers. We will now see what the numbers have to show −
Here we can see line numbers along with other useful options. If you observe carefully just before class name and main method there is a small green triangle. It provides option to run, debug and run application with coverage. Just click on the triangle icon and it will provide options.
You can see the small plus symbol at line number 6. This is the code folding functionality. If you click on that icon, then it will unfold it. Code folding can be done at class, method, loop and other block levels.
At line numbers 11 and 14, there are 2 arrows which point towards each other. The marker represents the method’s start and end position. If you click on any arrow, then it will perform the fold action on that code block. The Gutter area will show various symbols when certain actions are taken; for instance, it will show symbols for breakpoints, Java annotations.
Status Bar
At the bottom of the Editor window, there is a status bar, which shows information about the current file and the project status.
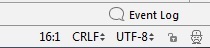

In the first image, 16:1 represents the current line number and the column number respectively.
Next is the line separator, for UNIX and mac OS it’s \n and for windows it’s \r.
UTF-8 represents the file encoding.
Next is the lock icon. We can toggle file’s read-only attribute by clicking on it.
At the end, there is a symbol with a man’s face. It allows managing the code inspection level.
When we type code in Editor, IntelliJ inspects code on the fly and shows hints/suggestion. We can decide the inspection level from here. For instance, we can completely disable it or allow inspection only for syntax and so on.
We can also enable the Power Save mode from here, which will disable background code analysis and other background jobs.
The Status bar also shows information about project actions. For instance, second image show information about project compilation.
Scratches
IntelliJ provides a temporary Editor. You can create text or piece of code without modifying the current project structure. It provides two types of temporary files −
Scratch files
They are functional, run-able and debug-able. To create a scratch file −
Go to File → New → Scratch file.
Select the language of your choice.
It will create a file in the IntelliJ-Installation-Directory\ config \scratches folder.
Scratch buffers
This is used only for creating any text. To create a scratch buffer −
Press Ctrl + Shift + A or click on Search Everywhere icon
It will pop up dialog box.
Enter new scratch buffer text in that box and press enter.
It’ll open scratch buffer in editor window.
Like the scratch files, scratch buffers are also stored in the IntelliJ-Installation-Directory\config\scratches folder.
Scrollbar
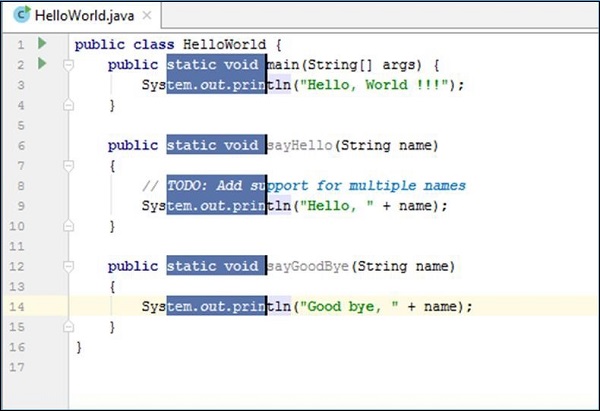
Scrollbar highlights warnings/error messages/TODO markers from the code. For instance, the sayHello() and sayGoodBye() method is never used; hence, the scrollbar shows yellow marker for them.
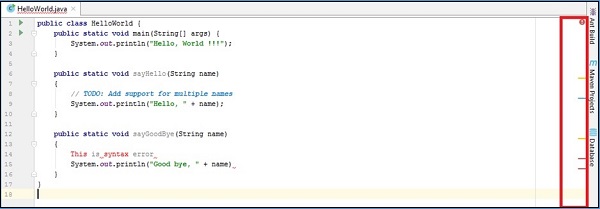
At line number 8, there is the TODO comment, scrollbar highlights it using the blue marker. Errors are highlighted using red marker.
Editor Actions
In this section, we will discuss the Editor actions in IntelliJ.
Search and Replace
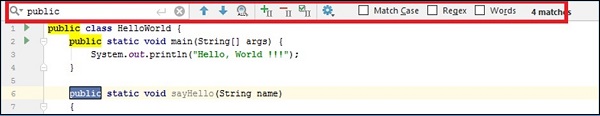
To search text in the current file −
Navigate to the file in the Editor window and press Ctrl+F.
It will show text box, type text to be searched there.
You can provide various options here - case sensitive match, exact match, regular expression and so on.
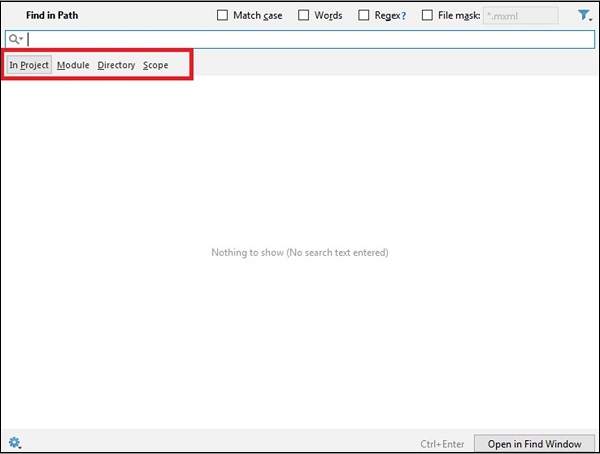
You can perform the search operation at a very granular level. For instance, search can be done at project, module or directory level −
Press the Ctrl+Shift+F key combination.
A new window will appear; from here, you can select the appropriate level.
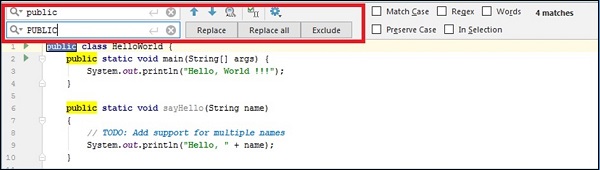
To perform a replace action in the current file −
Press the Ctrl+R key combination.
A dialog box will appear, enter the text to be replaced here.
This operation allows you to replace single match, all matches or skip current match.
To perform the replace action at a granular level −
Press the Shift+Ctrl+R key combination.
It will allow you replace text at project, module, directory and other scopes.
Column Selection Mode
To enable the column mode selection, hold the Alt key while selecting the text. To enable the column selection mode on a permanent basis, select Edit → Column selection mode.
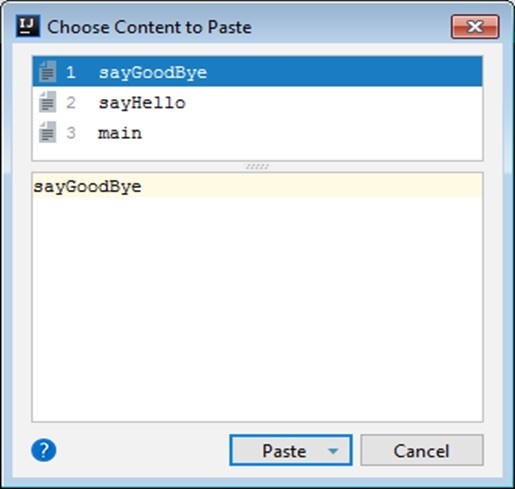
Clipboard History
When we copy any text, it goes to the clipboard history. IntelliJ maintains the clipboard history. To view this history, pressthe Ctrl+Shift+V key combination. You can select the content to paste from this window.
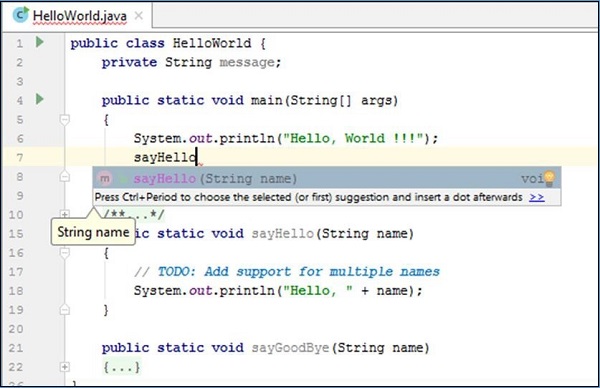
Code Completion
IntelliJ inspects the code on the fly and provides accurate code completion. For instance, when I type the word say - it suggests sayHello() and sayGoodBye() methods.
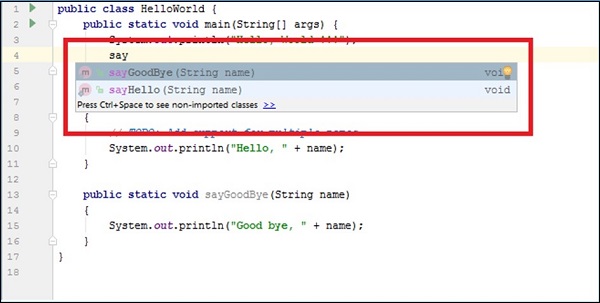
Code completion suggests class attributes and class methods while working with the class objects.
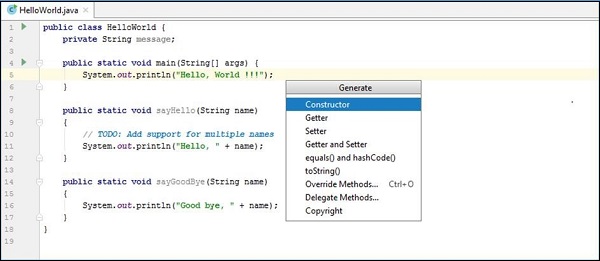
Generating Code
IntelliJ provides a way to generate useful code like constructor, getter, setter, toString() method, override methods and so on. Follow these steps to generate right-click in the Editor window.
Select the Generate option.
It will list the methods for which code can be can generated.
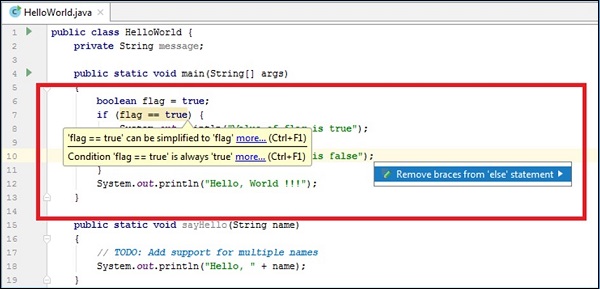
Code Inspection
We have already seen that IntelliJ identifies syntax errors, warning messages and TODO markers. In addition to this, it suggests code improvement, identifies dead code, code optimization. For instance, in the code given below, the value of flag is always true. Hence, the else part will never be executed.
boolean flag = true;
if (flag == true) {
   System.out.println("Value of flag is true");
} else {
   System.out.println("Value of flag is false");
}
IntelliJ identifies this and suggests removing this code block.
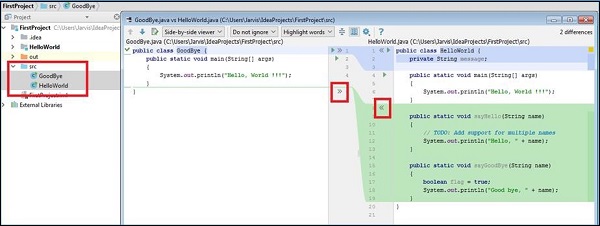
Comparing Files and Folders
Follow these steps to compare files and folders −
Hold the Ctrl key and select files to be compared from the project perspective.
Right-click on it and select the Compare Files option.
It will open the Compare window where the changes are highlighted.
You can also apply the changes from one file to another. If you observe, there are two arrow markers highlighted in red color. Click on them to apply changes from other file. Press Ctrl+Z to undo the changes.
Similarly, to compare the folders, select folders from project perspective instead of files.
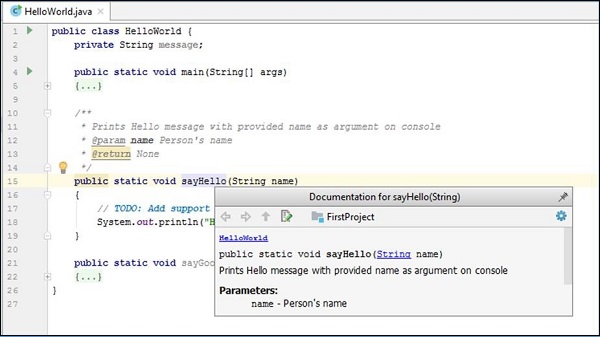
Getting Help
It is useful if you get details about code easily. Like the method description, its return type, arguments type and number of arguments - IntelliJ can provide these details in the Editor window itself.
Inline Documentation
As the name suggests, IntelliJ can access documentation by extracting it from the code. If you provide Java Docs for your code, then IntelliJ can show help about it. To access inline documentation, hover click on method name and press the Ctrl+Q key combination.
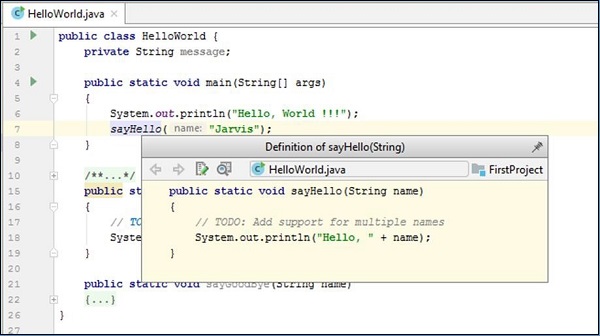
Viewing Definition
To view definition, hover the mouse over method name and press the Ctrl+Shift+I key combination.
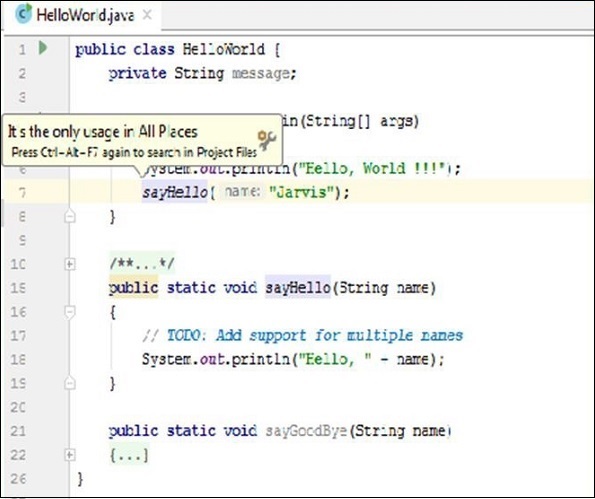
Show Usage
To view method usage, click on method declaration/definition and press the Alt+Ctrl+F7 key combination.
View Parameters
To view the method parameters, type method name and press the Ctrl+P key combination.
Linting Code
Linting is a process in which the lint tool analyzes the source codes and reports potential issues related to the coding standard. It helps in improving the code quality. IntelliJ supports SonarLint plug-in which lints the code.
About SonarLint
Once you install and enable the SonarLint plug-in, it will start analyzing the code automatically when you open a file in the Editor window. It will report issues in the SonarLint panel. We will discuss more about it in this section.
SonarLint supports popular programming languages like Java, JavaScript, PHP and Python.
Installation
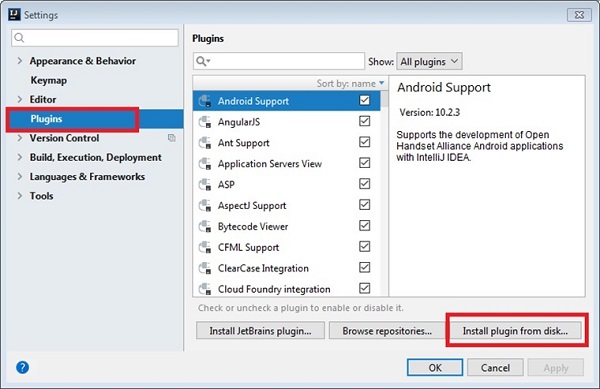
Follow these steps to install SonarLint −
Download SonarLint from here.
Go to File → Settings → Select plugins.
Click on the Install plugin from disk button.
Follow on-screen installation to complete the installation procedure.
Code Analysis
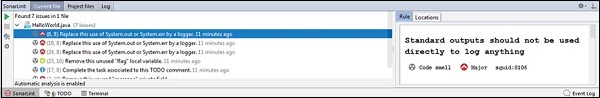
Once the plug-in is installed and enabled, it will start analyzing code on the fly. It will report issues in the SonarLint panel. Follow these steps to view issues of the current file −
Click on the Current file tab.
It will report issues like unused local variables, unused class attributes, message logging and so on.
To know more about issue, click on issue from SolarLint panel.
In the right side of the window, it will show its severity as Major, Minor and so on.
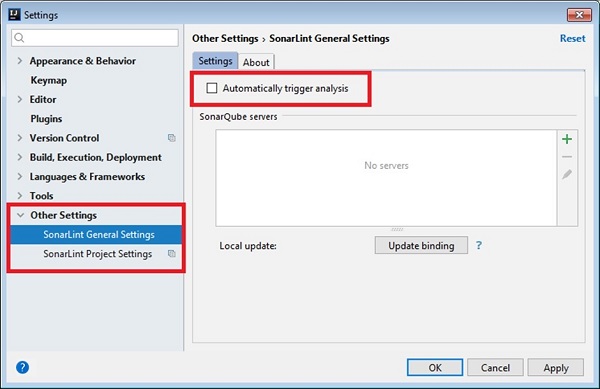
Do One Time Code Analysis
If you are not comfortable with on-the-fly code analysis, then you can disable it and perform one time code analysis once you are ready with code. Follow these steps to disable on-the-fly code analysis −
Go to File → Settings → Other Setting → SonarLint General Settings
Uncheck Automatically Trigger Analysis checkbox from the settings tab.
Click on Apply followed by Ok button.