- Data Warehousing Tutorial
- DWH - Home
- DWH - Overview
- DWH - Concepts
- DWH - Terminologies
- DWH - Delivery Process
- DWH - System Processes
- DWH - Architecture
- DWH - OLAP
- DWH - Relational OLAP
- DWH - Multidimensional OLAP
- DWH - Schemas
- DWH - Partitioning Strategy
- DWH - Metadata Concepts
- DWH - Data Marting
- DWH - System Managers
- DWH - Process Managers
- DWH - Security
- DWH - Backup
- DWH - Tuning
- DWH - Testing
- DWH - Future Aspects
- DWH - Interview Questions
- DWH Useful Resources
- DWH - Quick Guide
- DWH - Useful Resources
- DWH - Discussion
Data Warehousing - OLAP
Online Analytical Processing Server (OLAP) is based on the multidimensional data model. It allows managers, and analysts to get an insight of the information through fast, consistent, and interactive access to information. This chapter cover the types of OLAP, operations on OLAP, difference between OLAP, and statistical databases and OLTP.
Types of OLAP Servers
We have four types of OLAP servers −
- Relational OLAP (ROLAP)
- Multidimensional OLAP (MOLAP)
- Hybrid OLAP (HOLAP)
- Specialized SQL Servers
Relational OLAP
ROLAP servers are placed between relational back-end server and client front-end tools. To store and manage warehouse data, ROLAP uses relational or extended-relational DBMS.
ROLAP includes the following −
- Implementation of aggregation navigation logic.
- Optimization for each DBMS back end.
- Additional tools and services.
Multidimensional OLAP
MOLAP uses array-based multidimensional storage engines for multidimensional views of data. With multidimensional data stores, the storage utilization may be low if the data set is sparse. Therefore, many MOLAP server use two levels of data storage representation to handle dense and sparse data sets.
Hybrid OLAP
Hybrid OLAP is a combination of both ROLAP and MOLAP. It offers higher scalability of ROLAP and faster computation of MOLAP. HOLAP servers allows to store the large data volumes of detailed information. The aggregations are stored separately in MOLAP store.
Specialized SQL Servers
Specialized SQL servers provide advanced query language and query processing support for SQL queries over star and snowflake schemas in a read-only environment.
OLAP Operations
Since OLAP servers are based on multidimensional view of data, we will discuss OLAP operations in multidimensional data.
Here is the list of OLAP operations −
- Roll-up
- Drill-down
- Slice and dice
- Pivot (rotate)
Roll-up
Roll-up performs aggregation on a data cube in any of the following ways −
- By climbing up a concept hierarchy for a dimension
- By dimension reduction
The following diagram illustrates how roll-up works.
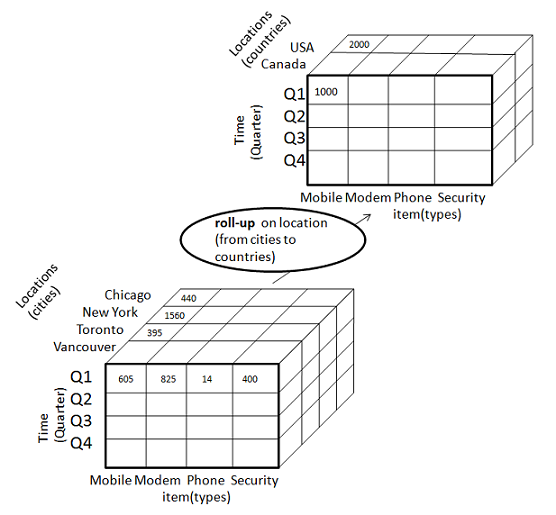
Roll-up is performed by climbing up a concept hierarchy for the dimension location.
Initially the concept hierarchy was "street < city < province < country".
On rolling up, the data is aggregated by ascending the location hierarchy from the level of city to the level of country.
The data is grouped into cities rather than countries.
When roll-up is performed, one or more dimensions from the data cube are removed.
Drill-down
Drill-down is the reverse operation of roll-up. It is performed by either of the following ways −
- By stepping down a concept hierarchy for a dimension
- By introducing a new dimension.
The following diagram illustrates how drill-down works −
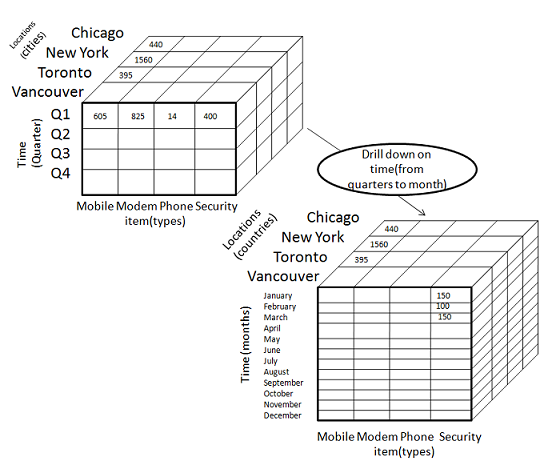
Drill-down is performed by stepping down a concept hierarchy for the dimension time.
Initially the concept hierarchy was "day < month < quarter < year."
On drilling down, the time dimension is descended from the level of quarter to the level of month.
When drill-down is performed, one or more dimensions from the data cube are added.
It navigates the data from less detailed data to highly detailed data.
Slice
The slice operation selects one particular dimension from a given cube and provides a new sub-cube. Consider the following diagram that shows how slice works.
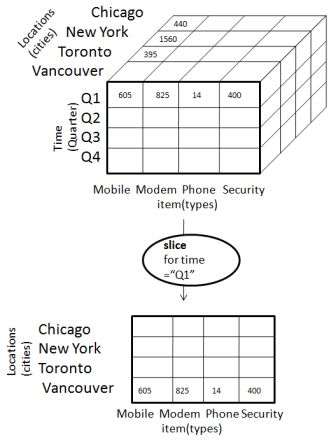
Here Slice is performed for the dimension "time" using the criterion time = "Q1".
It will form a new sub-cube by selecting one or more dimensions.
Dice
Dice selects two or more dimensions from a given cube and provides a new sub-cube. Consider the following diagram that shows the dice operation.
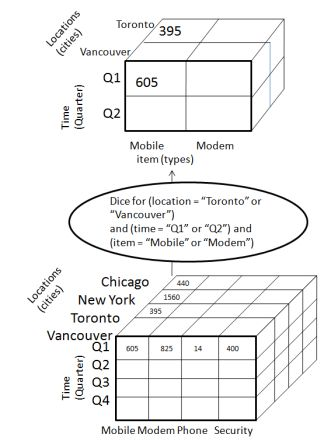
The dice operation on the cube based on the following selection criteria involves three dimensions.
- (location = "Toronto" or "Vancouver")
- (time = "Q1" or "Q2")
- (item =" Mobile" or "Modem")
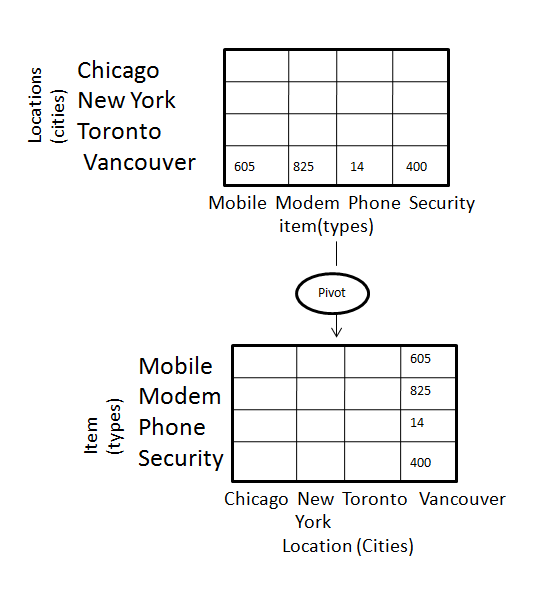
Pivot
The pivot operation is also known as rotation. It rotates the data axes in view in order to provide an alternative presentation of data. Consider the following diagram that shows the pivot operation.
OLAP vs OLTP
| Sr.No. | Data Warehouse (OLAP) | Operational Database (OLTP) |
|---|---|---|
| 1 | Involves historical processing of information. | Involves day-to-day processing. |
| 2 | OLAP systems are used by knowledge workers such as executives, managers and analysts. | OLTP systems are used by clerks, DBAs, or database professionals. |
| 3 | Useful in analyzing the business. | Useful in running the business. |
| 4 | It focuses on Information out. | It focuses on Data in. |
| 5 | Based on Star Schema, Snowflake, Schema and Fact Constellation Schema. | Based on Entity Relationship Model. |
| 6 | Contains historical data. | Contains current data. |
| 7 | Provides summarized and consolidated data. | Provides primitive and highly detailed data. |
| 8 | Provides summarized and multidimensional view of data. | Provides detailed and flat relational view of data. |
| 9 | Number or users is in hundreds. | Number of users is in thousands. |
| 10 | Number of records accessed is in millions. | Number of records accessed is in tens. |
| 11 | Database size is from 100 GB to 1 TB | Database size is from 100 MB to 1 GB. |
| 12 | Highly flexible. | Provides high performance. |