- ArangoDB Tutorial
- ArangoDB - Home
- A Multi-Model First Database
- ArangoDB – Advantages
- Basic Concepts & Terminologies
- ArangoDB – System Requirements
- ArangoDB – Command Line
- ArangoDB - Web Interface
- ArangoDB - Example Case Scenarios
- Data Models & Modeling
- ArangoDB - Database Methods
- ArangoDB - Crud Operations
- Crud Operations Using Web Interface
- Querying The Data With AQL
- ArangoDB - AQL Example Queries
- ArangoDB – How To Deploy
- ArangoDB Useful Resources
- ArangoDB - Quick Guide
- ArangoDB - Useful Resources
- ArangoDB - Discussion
ArangoDB - Example Case Scenarios
In this chapter, we will consider two example scenarios. These examples are easier to comprehend and will help us understand the way the ArangoDB functionality works.
To demonstrate the APIs, ArangoDB comes preloaded with a set of easily understandable graphs. There are two methods to create instances of these graphs in your ArangoDB −
- Add Example tab in the create graph window in the web interface,
- or load the module @arangodb/graph-examples/example-graph in Arangosh.
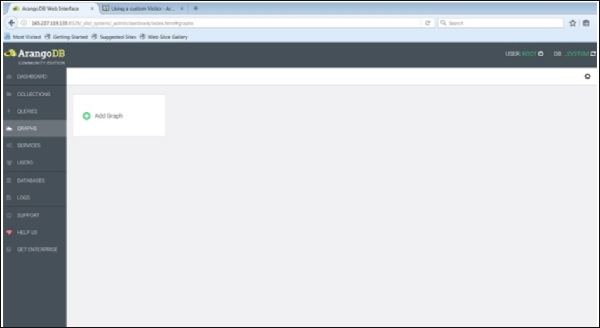
To start with, let us load a graph with the help of web interface. For that, launch the web interface and click on the graphs tab.
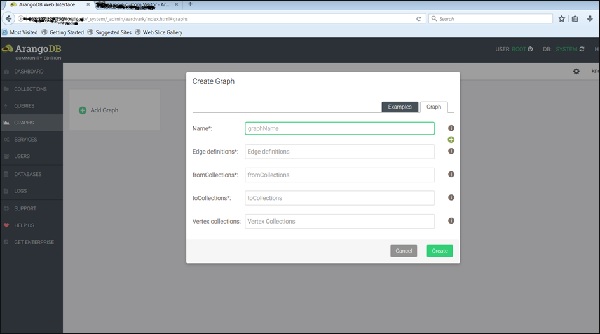
The Create Graph dialog box appears. The Wizard contains two tabs – Examples and Graph. The Graph tab is open by default; supposing we want to create a new graph, it will ask for the name and other definitions for the graph.
Now, we will upload the already created graph. For this, we will select the Examples tab.
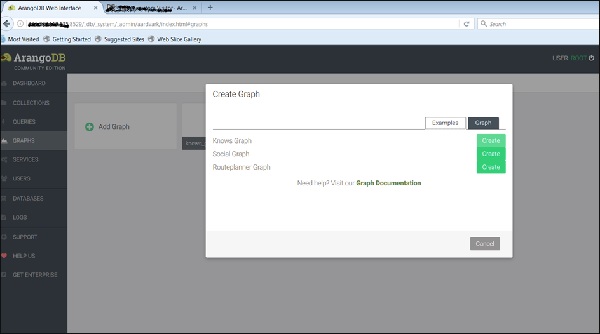
We can see the three example graphs. Select the Knows_Graph and click on the green button Create.
Once you have created them, you can inspect them in the web interface - which was used to create the pictures below.
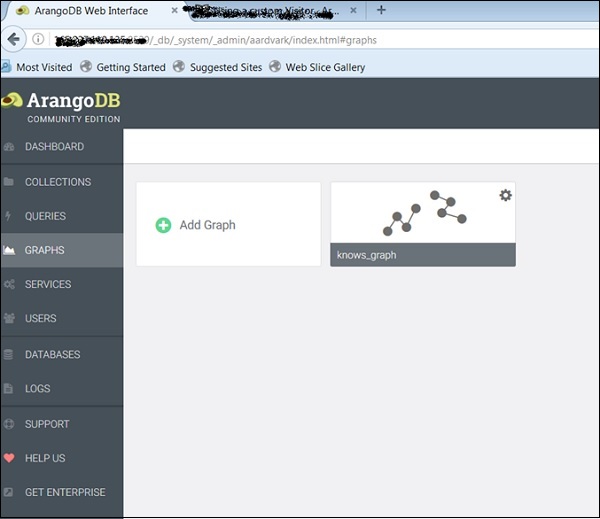
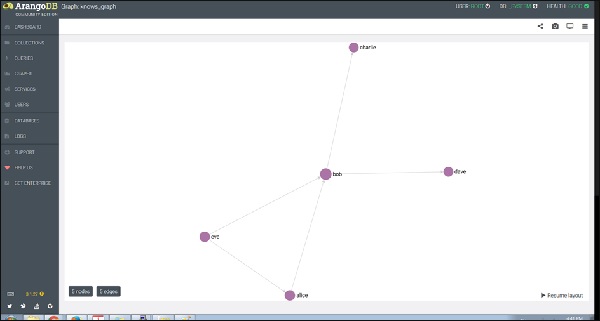
The Knows_Graph
Let us now see how the Knows_Graph works. Select the Knows_Graph, and it will fetch the graph data.
The Knows_Graph consists of one vertex collection persons connected via one edge collection knows. It will contain five persons Alice, Bob, Charlie, Dave and Eve as vertices. We will have the following directed relations
Alice knows Bob
Bob knows Charlie
Bob knows Dave
Eve knows Alice
Eve knows Bob
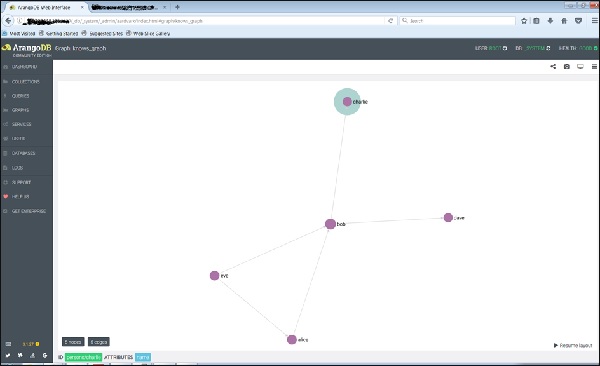
If you click a node (vertex), say ‘bob’, it will show the ID (persons/bob) attribute name.
And on clicking any of the edge, it will show the ID (knows/4590) attributes.
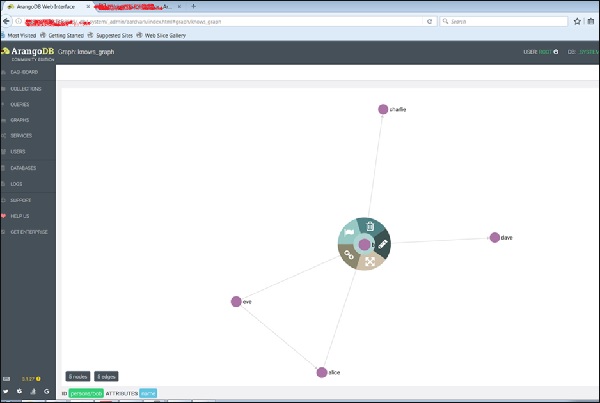
This is how we create it, inspect its vertices and edges.
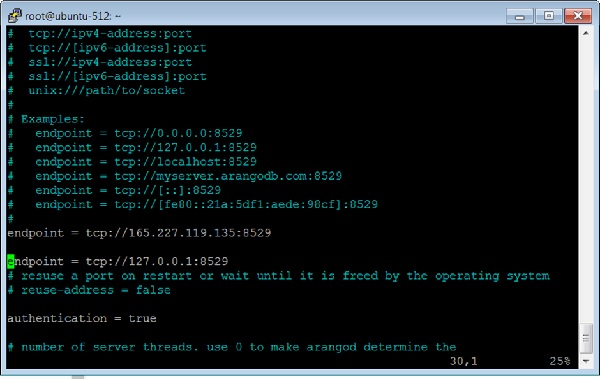
Let us add another graph, this time using Arangosh. For that, we need to include another endpoint in the ArangoDB configuration file.
How to Add Multiple Endpoints
Open the configuration file −
# vim /etc/arangodb3/arangod.conf
Add another endpoint as shown in the terminal screenshot below.
Restart the ArangoDB −
# service arangodb3 restart
Launch the Arangosh −
# arangosh
Please specify a password:
_
__ _ _ __ __ _ _ __ __ _ ___ ___| |__
/ _` | '__/ _` | '_ \ / _` |/ _ \/ __| '_ \
| (_| | | | (_| | | | | (_| | (_) \__ \ | | |
\__,_|_| \__,_|_| |_|\__, |\___/|___/_| |_|
|___/
arangosh (ArangoDB 3.1.27 [linux] 64bit, using VPack 0.1.30, ICU 54.1, V8
5.0.71.39, OpenSSL 1.0.2g 1 Mar 2016)
Copyright (c) ArangoDB GmbH
Pretty printing values.
Connected to ArangoDB 'http+tcp://127.0.0.1:8529' version: 3.1.27
[server], database: '_system', username: 'root'
Please note that a new minor version '3.2.2' is available
Type 'tutorial' for a tutorial or 'help' to see common examples
127.0.0.1:8529@_system>
The Social_Graph
Let us now understand what a Social_Graph is and how it works. The graph shows a set of persons and their relations −
This example has female and male persons as vertices in two vertex collections - female and male. The edges are their connections in the relation edge collection. We have described how to create this graph using Arangosh. The reader can work around it and explore its attributes, as we did with the Knows_Graph.