
Article Categories
- All Categories
-
 Data Structure
-
 Networking
-
 RDBMS
RDBMS
-
 Operating System
-
 Java
Java
-
 MS Excel
-
 iOS
iOS
-
 HTML
HTML
-
 CSS
CSS
-
 Android
-
 Python
-
 C Programming
-
 C++
C++
-
 C#
C#
-
 MongoDB
-
 MySQL
MySQL
-
 Javascript
-
 PHP
PHP
-
 Economics & Finance
What are various XY charts provided by JavaFX?
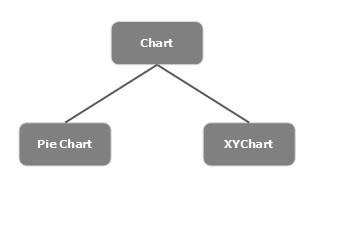
The javafx.scene.chart package, provides classes to create various charts namely − line chart, area chart, bar chart, pie chart, bubble chart, scatter chart etc.
All these charts belongs to the package javafx.scene.chart. The class named Chart is the base class of all the charts in JavaFX and the XYChart is base class of all those charts that are drawn on the XY–plane.
While creating an XY chart you need to −
Create x and Y Axes.
Create data points on these axes.
Create a series using the data points.
Add the series to the chart.
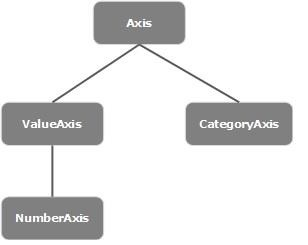
Defining the Axis
In general, the axis of the charts can be represented by −
Numbers such as Population, Age.
Categories such as Days in a Week, Countries.
In JavaFX, You can create a number axis by instantiating the javafx.scene.chart.NumberAxis class and category axis by instantiating the javafx.scene.chart.CategoryAxis class.
Following diagram represents the class hierarchy of the axes in JavaFX −
Passing Data to XY Charts
To plot a set of points in a XY-chart, we need to specify a series of XY coordinates.
The XYChart.Series represents the series of data items. Using this class can send data to a chart.
The XYChart.Data represents a specific data point in the x-y plane. To create a point, you need to instantiate this class by passing the x and y values of the particular point.
Therefore, to create data for a line −
Create a required number of points by instantiating the XYChart.Data class.
Create a series by instantiating the XYChart.Series class.
Get the observable list of the XYChart.Series class using the getData()method.
Add the created data points to the list using the add() or addAll() methods.
Add the created data series to the line chart as −
linechart.getData().add(series);
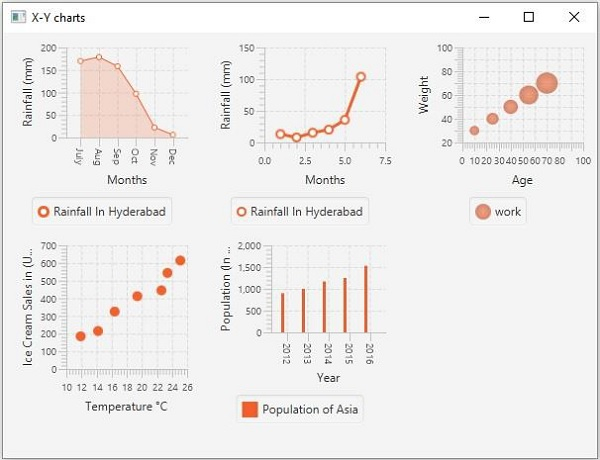
Example
Following JavaFX example demonstrates the creation of all the XY charts.
import javafx.application.Application;
import javafx.geometry.Side;
import javafx.scene.Scene;
import javafx.scene.chart.AreaChart;
import javafx.scene.chart.BarChart;
import javafx.scene.chart.BubbleChart;
import javafx.scene.chart.CategoryAxis;
import javafx.scene.chart.LineChart;
import javafx.stage.Stage;
import javafx.scene.chart.NumberAxis;
import javafx.scene.chart.ScatterChart;
import javafx.scene.chart.XYChart;
import javafx.scene.layout.FlowPane;
public class XYChartsExample extends Application {
   public void start(Stage stage) {
      //Creating an area chart
      CategoryAxis xAxis = new CategoryAxis();
      NumberAxis yAxis = new NumberAxis();
      xAxis.setLabel("Months");
      yAxis.setLabel("Rainfall (mm)");
      AreaChart areaChart = new AreaChart(xAxis, yAxis);
      XYChart.Series series = new XYChart.Series();
      series.getData().add(new XYChart.Data("July", 169.9));
      series.getData().add(new XYChart.Data("Aug", 178.7));
      series.getData().add(new XYChart.Data("Sep", 158.3));
      series.getData().add(new XYChart.Data("Oct", 97.2));
      series.getData().add(new XYChart.Data("Nov", 22.4));
      series.getData().add(new XYChart.Data("Dec", 5.9));
      series.setName("Rainfall In Hyderabad");
      //Setting data to the area chart
      areaChart.getData().addAll(series);
      areaChart.setPrefSize(200, 200);
      //Creating the Bar chart
      CategoryAxis xAxis1 = new CategoryAxis();
      xAxis1.setLabel("Year");
      NumberAxis yAxis1 = new NumberAxis();
      yAxis1.setLabel("Population (In millions)");
      BarChart barchart = new BarChart(xAxis1, yAxis1);
      XYChart.Series<String, Number> series1 = new XYChart.Series<>();
      series1.setName("Asia");
      series1.getData().add(new XYChart.Data<>("2012", 900));
      series1.getData().add(new XYChart.Data<>("2013", 1000));
      series1.getData().add(new XYChart.Data<>("2014", 1170));
      series1.getData().add(new XYChart.Data<>("2015", 1250));
      series1.getData().add(new XYChart.Data<>("2016", 1530));
      series1.setName("Population of Asia");
      barchart.getData().addAll(series1);
      barchart.setPrefSize(200, 200);
      //Creating a bubble chart
      NumberAxis xAxis2 = new NumberAxis(0, 100, 10);
      NumberAxis yAxis2 = new NumberAxis(20, 100, 10);
      xAxis2.setLabel("Age");
      yAxis2.setLabel("Weight");
      BubbleChart bubbleChart = new BubbleChart(xAxis2, yAxis2);
      XYChart.Series series2 = new XYChart.Series();
      series2.getData().add(new XYChart.Data(10, 30, 4));
      series2.getData().add(new XYChart.Data(25, 40, 5));
      series2.getData().add(new XYChart.Data(40, 50, 6));
      series2.getData().add(new XYChart.Data(55, 60, 8));
      series2.getData().add(new XYChart.Data(70, 70, 9));
      bubbleChart.getData().add(series2);
      series2.setName("work");
      bubbleChart.setPrefSize(200, 200);
      //Creating a line chart
      NumberAxis xAxis3 = new NumberAxis();
      NumberAxis yAxis3 = new NumberAxis();
      //Setting labels for the axes
      xAxis3.setLabel("Months");
      yAxis3.setLabel("Rainfall (mm)");
      LineChart linechart = new LineChart(xAxis3, yAxis3);
      XYChart.Series series3 = new XYChart.Series();
      series3.getData().add(new XYChart.Data(1, 13.2));
      series3.getData().add(new XYChart.Data(2, 7.9));
      series3.getData().add(new XYChart.Data(3, 15.3));
      series3.getData().add(new XYChart.Data(4, 20.2));
      series3.getData().add(new XYChart.Data(5, 35.7));
      series3.getData().add(new XYChart.Data(6, 103.8));
      series3.setName("Rainfall In Hyderabad");
      //Setting the data to Line chart
      linechart.getData().add(series3);
      linechart.setPrefSize(200, 200);
      //Creating a scatter chart
      NumberAxis xAxis4 = new NumberAxis(10, 26, 2);
      NumberAxis yAxis4 = new NumberAxis(0, 700, 100);
      xAxis4.setLabel("Temperature °C");
      yAxis4.setLabel("Ice Cream Sales in (USD)");
      ScatterChart scatterChart = new ScatterChart(xAxis4, yAxis4);
      XYChart.Series series4 = new XYChart.Series();
      series4.getData().add(new XYChart.Data(14.2, 215));
      series4.getData().add(new XYChart.Data(16.4, 325));
      series4.getData().add(new XYChart.Data(11.9, 185));
      series4.getData().add(new XYChart.Data(19.4, 412));
      series4.getData().add(new XYChart.Data(25.1, 614));
      series4.getData().add(new XYChart.Data(23.4, 544));
      series4.getData().add(new XYChart.Data(22.6, 445));
      scatterChart.getData().addAll(series4);
      series4.setName("Temperatue vs Icecream Sales");
      scatterChart.setPrefSize(200, 200);
      scatterChart.setLegendSide(Side.RIGHT);
      //Creating a flow pane
      FlowPane pane = new FlowPane();
      pane.getChildren().addAll(areaChart, linechart, bubbleChart, scatterChart, barchart);
      //Setting the Scene
      Scene scene = new Scene(pane, 600, 430);
      stage.setTitle("X-Y charts");
      stage.setScene(scene);
      stage.show();
   }
   public static void main(String args[]){
      launch(args);
   }
}
Output

740 Views
