
Article Categories
- All Categories
-
 Data Structure
-
 Networking
-
 RDBMS
RDBMS
-
 Operating System
-
 Java
Java
-
 MS Excel
-
 iOS
iOS
-
 HTML
HTML
-
 CSS
CSS
-
 Android
-
 Python
-
 C Programming
-
 C++
C++
-
 C#
C#
-
 MongoDB
-
 MySQL
MySQL
-
 Javascript
-
 PHP
PHP
-
 Economics & Finance
How to remove the tick marks in JavaFX XY charts?
The javafx.scene.XYChart class is the base class of all the charts that are plotted in an x-y pane. By instantiating the subclasses of this class you can create various XY charts namely − line chart, area chart, bar chart, pie chart, bubble chart, scatter chart, etc.
In the XY chart, the given data points are plotted on an XY plane. Along the x and y axes, you will have the tick marks and tick labels. The tick marks represent various values with uniform intervals.
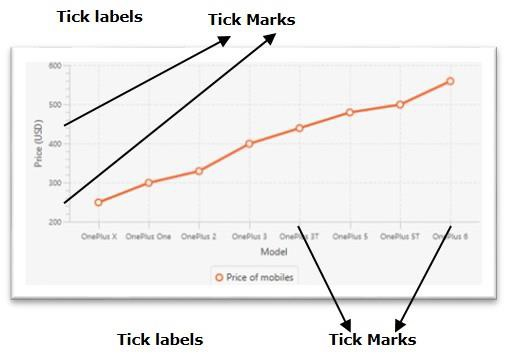
Removing the tick marks
The javafx.scene.chart.Axis class (abstract) is the base class of all the axes in XY charts. To create X and Y axes you need to instantiate subclasses of these classes
The NumberAxis class is used to create an axis for numerical values and the CategoryAxis class is used to create axis for string categories.
This class has a property named tickMarkVisible (boolean), it specifies whether to show the tick marks or not. You can set the value of this property using the setTickMarkVisible() method.
To remove the tick marks of an XY chart invoke this method by passing the boolean value false.
Example
import javafx.application.Application;
import javafx.geometry.Insets;
import javafx.scene.Scene;
import javafx.stage.Stage;
import javafx.scene.chart.CategoryAxis;
import javafx.scene.chart.LineChart;
import javafx.scene.chart.NumberAxis;
import javafx.scene.chart.XYChart;
import javafx.scene.layout.StackPane;
public class RemovingTickMarks extends Application {
   public void start(Stage stage) {
      //Defining the x an y axes
      CategoryAxis xAxis = new CategoryAxis();
      NumberAxis yAxis = new NumberAxis(200, 600, 100);
      //Setting labels for the axes
      xAxis.setLabel("Model");
      yAxis.setLabel("Price (USD)");
      //Creating a line chart
      LineChart linechart = new LineChart(xAxis, yAxis);
      //Preparing the data points for the line
      XYChart.Series series = new XYChart.Series();
      series.getData().add(new XYChart.Data("OnePlus X", 249));
      series.getData().add(new XYChart.Data("OnePlus One", 299));
      series.getData().add(new XYChart.Data("OnePlus 2", 329));
      series.getData().add(new XYChart.Data("OnePlus 3", 399));
      series.getData().add(new XYChart.Data("OnePlus 3T", 439));
      series.getData().add(new XYChart.Data("OnePlus 5", 479));
      series.getData().add(new XYChart.Data("OnePlus 5T", 499));
      series.getData().add(new XYChart.Data("OnePlus 6", 559));
      //Setting the name to the line (series)
      series.setName("Price of mobiles");
      //Setting the data to Line chart
      linechart.getData().add(series);
      //Removing the tick marks
      xAxis.setTickMarkVisible(false);
      yAxis.setTickMarkVisible(false);
      //Creating a stack pane to hold the chart
      StackPane pane = new StackPane(linechart);
      pane.setPadding(new Insets(15, 15, 15, 15));
      pane.setStyle("-fx-background-color: BEIGE");
      //Setting the Scene
      Scene scene = new Scene(pane, 595, 300);
      stage.setTitle("JavaFX Example");
      stage.setScene(scene);
      stage.show();
   }
   public static void main(String args[]){
      launch(args);
   }
}
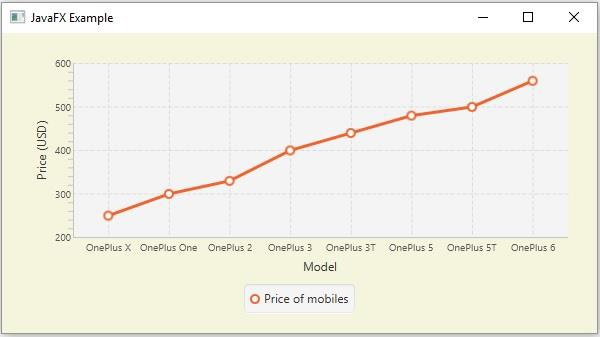
Output

398 Views
