 Data Structure
 Networking
 RDBMS
RDBMS Operating System
 Java
Java MS Excel
 iOS
iOS HTML
HTML CSS
CSS Android
 Python
 C Programming
 C++
C++ C#
C# MongoDB
 MySQL
MySQL Javascript
 PHP
PHP
- Selected Reading
- UPSC IAS Exams Notes
- Developer's Best Practices
- Questions and Answers
- Effective Resume Writing
- HR Interview Questions
- Computer Glossary
- Who is Who
Python program to draw a bar chart using turtle
Graphical representation of the data provides an enhanced understanding of the complex sub structures of the data and it helps us to easily interpret the hidden patterns and trends. Imagine how convenient it would be if we could just draw a similar relationship programmatically? Python offers a prolific module that is precisely designed to perform such operation and it is known as "turtle".
The "turtle" module is a built-in python library that allows us to draw graphics on a "turtle graphics screen". In this article, we will create a bar chart using this turtle module.
Understanding the Turtle Module
The turtle module uses a virtual turtle object to create graphics. There are different functions associated with this module that empowers this turtle object to move around the screen and draw over it. Let's talk about the different functions we require to create a bar chart.
Turtle Functions for Creating a Bar Chart
Turtle() ? This function creates a new turtle object.
fillcolor() ? This function sets the turtle color to be filled in a bar.
begin_fill() ? This function starts the filling process and remembers the starting point.
left() ? This function makes the turtle turn left by 90 degrees.
right() ? This function makes the turtle turn right by 90 degrees.
forward() ? This function makes the turtle to move forward by the specified units.
write() ? This function will write a string(height value) on a bar.
end_fill() ? This function closes the bar and stops the filling process.
All of these functions together create a bar chart but we have to prepare a proper program in order to make these functions work as a unit. Now that we have understood the mechanism, let's draw a bar graph.
Drawing a Bar Graph
The turtle module is inspired by the LOGO programming language, which allows the user to create shapes on a virtual screen. For drawing a bar graph, we need to set our turtle at the lower left-hand corner of the screen. By default the turtle is present at centre (0,0) but we can change these coordinates with the help of "setworldcoordinates()" method.
This method allows the user to rescale the window and make it fit for the data. It takes four coordinates ?
Coordinates for the X&Y axis of the lower-left and right corners.
Coordinates for the X&Y axis of the upper-left and right corners.
This method acts as a reset tool and adjust the coordinates according to the size of the data. We use the maximum bar height value and the total space values to set these coordinates.
Example
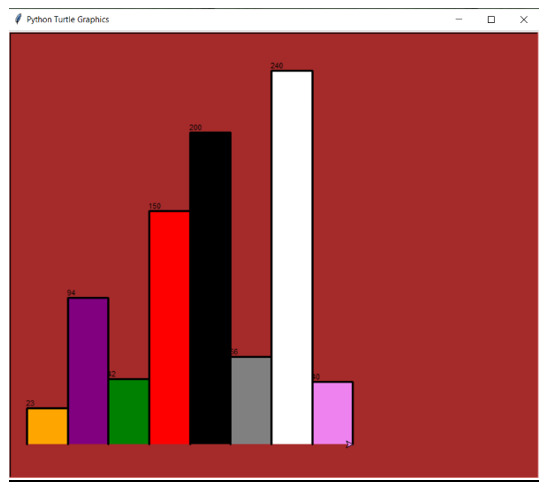
Following is the implementation of the above-discussed concept.
We will create a function that takes a "turtle object", the "bar heights" and the "bar color" as the parameters. After this we will program the function to draw bars of variable heights and different colors.
Different height and color values will be passed in the form of a list and we will call the function for each of these values through iterations.
Finally, we will use the turtle object to craft a pen and start the process. Once the drawing is complete, we will close the turtle instance. The turtle graphics screen is created with the help of "Screen()" method.
Example
import turtle

def BarGraph(turtleOBJ, Bar_height, Bar_color):
   turtleOBJ.fillcolor(Bar_color)
   turtleOBJ.begin_fill()
   turtleOBJ.left(90)
   turtleOBJ.forward(Bar_height)
   turtleOBJ.write(str(Bar_height))
   turtleOBJ.right(90)
   turtleOBJ.forward(80)
   turtleOBJ.right(90)
   turtleOBJ.forward(Bar_height)
   turtleOBJ.left(90)

   turtleOBJ.end_fill()

Bar_heights = [23, 94, 42, 150, 200, 56, 240,40]
Bar_color = ["orange", "purple", "green", "red", "black", "grey", "white", "violet"]

maxBarVal = max(Bar_heights)
Graph_Range = len(Bar_heights)
Space = 20

screen = turtle.Screen()
screen.setworldcoordinates(0 - Space, 0 - Space, 50 * Space, maxBarVal + Space)
screen.bgcolor("Brown")

turtleOBJ = turtle.Turtle()
turtleOBJ.pensize(3)

for bar in range(len(Bar_heights)):
   BarGraph(turtleOBJ, Bar_heights[bar], Bar_color[bar])
screen.exitonclick()
Output

Other Insights
We can add frames to this bar chart and can also design the scales for the X and Y axis. The turtle module is designed strictly for creating graphics based on the data we have. We cannot use it for statistical estimations. Although it can work in conjunction with other powerful python libraries such as "NumPy" and "Pandas" empowering them with statistical and visual capabilities. For a more deep and precise estimations we use the "matplotlib" library.
Conclusion
This article explains the mechanism of turtle module and how it can be used to create a bar graph. We discussed the various functions and parameters that can be used to programmatically generate a bar graph on a turtle graphics screen. The values used in the program are based on the data we want to visualize and it cannot be further statistically interpreted.

