 Data Structure
 Networking
 RDBMS
RDBMS Operating System
 Java
Java MS Excel
 iOS
iOS HTML
HTML CSS
CSS Android
 Python
 C Programming
 C++
C++ C#
C# MongoDB
 MySQL
MySQL Javascript
 PHP
PHP
- Selected Reading
- UPSC IAS Exams Notes
- Developer's Best Practices
- Questions and Answers
- Effective Resume Writing
- HR Interview Questions
- Computer Glossary
- Who is Who
How to create a bar chart and save in pptx using Python?
Data visualization is an essential part of data analysis and communication, and Python offers many tools and libraries to create visually appealing and informative charts. Two such libraries are Plotly and pptx. Plotly is a powerful library for creating interactive charts, including bar charts, while pptx is a library for working with PowerPoint presentations.
Creating a bar chart using Plotly is relatively easy. You can specify the data to be plotted, the type of chart, and the layout of the chart, and Plotly will generate a highquality chart that can be easily customised. Once the chart is created, you can save it as an image file or an HTML file.
However, if you want to include the chart in a PowerPoint presentation, you need to use a library like pptx to create the presentation and insert the chart as an image. pptx is a Python library that allows you to create and manipulate PowerPoint presentations programmatically. You can create slides, add text, images, and charts, and save the presentation to a file.
In this article, we will explore how to create a bar chart using Plotly and save it in a PowerPoint presentation using pptx. We will start by discussing how to install and import the necessary libraries and then move on to creating the chart and inserting it into a PowerPoint presentation. By the end of this article, you will have a good understanding of how to create bar charts and save them in a PowerPoint presentation using Python.
What is Plotly?
Plotly is a data visualization library that allows users to create interactive and publication-quality graphs and charts. It offers a wide range of charts, including scatter plots, line graphs, bar charts, and more, and is compatible with several programming languages, including Python, R, and MATLAB.
What is PPTX?
PPTX is a Python library for creating and updating PowerPoint (.pptx) files. It allows users to add slides, shapes, images, and text to a PowerPoint presentation, and offers a range of customization options.
Example
Now let's check a working example where we will convert a bar chart and then save it in pptx. Consider the code shown below.
# Importing required libraries
import plotly.graph_objs as go
import plotly.io as pio
from pptx import Presentation
from pptx.util import Inches

# Creating data for the bar chart
data = [go.Bar(x=['A', 'B', 'C'], y=[10, 20, 30])]

# Creating the layout for the chart
layout = go.Layout(title='My Bar Chart', xaxis_title='X-axis', yaxis_title='Y-axis')

# Creating the figure
fig = go.Figure(data=data, layout=layout)

# Saving the figure as an image using Plotly
pio.write_image(fig, 'my_bar_chart.png')

# Creating a PowerPoint presentation
prs = Presentation()

# Adding a new slide
slide = prs.slides.add_slide(prs.slide_layouts[1])

# Adding the chart image to the slide
chart = slide.shapes.add_picture('my_bar_chart.png', Inches(1), Inches(2), width=Inches(6), height=Inches(4))

# Saving the PowerPoint presentation
prs.save('my_presentation.pptx')
Explanation
We import the necessary libraries plotly.graph_objs, plotly.io, pptx, and pptx.util.
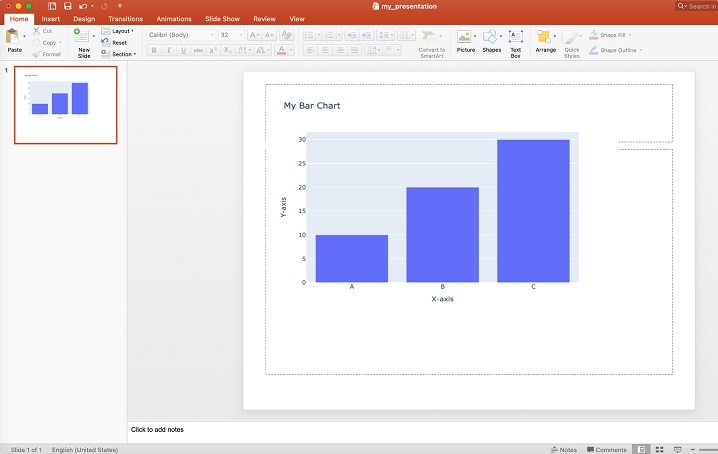
We create the data for the bar chart. In this example, we create a bar chart with three bars with values 10, 20, and 30, respectively, labelled as A, B, and C on the X-axis.
We create the layout for the chart. This includes the chart title, and the x-axis and y-axis titles.
We create the figure by passing the data and layout to the go.Figure() function.
We save the figure as an image using pio.write_image().
We create a new PowerPoint presentation using Presentation().
We add a new slide to the presentation using prs.slides.add_slide().
We add the chart image to the slide using slide.shapes.add_picture(). The add_picture() function takes the image path, the position of the image on the slide, and the width and height of the image as parameters.
We save the PowerPoint presentation using prs.save().
To run this code, you need to have plotly and pptx libraries installed. You can install them using the pip package manager.
Output
Once we run the above command in the terminal, it will create an image file my_bar_chart.png and a PowerPoint presentation file my_presentation.pptx in the same directory as the Python file. You can open the PowerPoint presentation to see the chart inserted into a slide.

Conclusion
In conclusion, creating a bar chart and saving it in pptx using Python is a simple and powerful way to automate the process of creating professional-looking presentations and reports. The use of the Plotly and pptx libraries makes the process straightforward and customizable.
By leveraging the power of these libraries, users can create interactive and customizable charts, and programmatically create and update PowerPoint presentations with ease.

